Walmart Embraces Amazon MCF: A New Era of Cross-Platform Fulfillment for eCommerce
Walmart Embraces Amazon MCF: A New Era of Cross-Platform Fulfillment for eCommerce
Pricing intelligence is a technique that can help you understand the market-level pricing intricacies and the impact on the businesses, typically employing modern data mining techniques. You can easily optimize your pricing strategy relative to your competition and subsequently boost sales. Pricing intelligence is used in several tools. Competition on Google Shopping is fierce and using Merchant Center tools in your Google Shopping pricing strategy could be a great idea to beat your competition.
The price competitiveness report helps you get insights into how competitive your product prices are compared to your competitors who are selling the same products.
You should have the Marketing Insights enabled in the “Growth”>” Manage Programs”> Market Insights.
Keep in mind that this report is only for the Shopping Ads and Free Listing on Google Shopping Tab. If the product you sell doesn’t get many clicks or sold by few retailers, you are more likely not to see this report as Google doesn’t have enough data.
Once you enable the Marketing insights, head over to the “Growth” section, and there you will find the Price Competitiveness report.
Given that Google has enough data on the type of product you are offering, your report will likely look like this:

The “above benchmark price” segment shows the percentage of auctions in which your products were more than 1% higher than the benchmark. “At benchmark price” indicates the percentage of auctions in which your products were within 1% +/- of the benchmark price, and “below benchmark price” represents auctions in which your products were at least 1% higher than the benchmark.
The price competitiveness report can be categorized according to the product, product type, category, or brand. On clicking the “View products,” you can get a detailed analysis of products.

First of all, it is a free tool that can help you accurately assess your competitiveness by product, brand, product type, or SKU.
If a long-term view of price benchmarking reports shows that you have been consistently priced below your competitors, you can raise the bids and strategize better.
As you take inputs from your competitors, you can take responsible pricing decisions. It could help you identify products, product types, brands, or categories with higher or too low prices and then set strategies for promotions or special offers.
Not only can you bid responsibly, but you can also get an idea of the performance trends. When identifying which products to promote on Shopping Ads, you can take this data as a reference.
Pricing rules is a tool that automatically manages the prices of your Buy on Google items. Pricing rules will lower your products’ costs from their regular price based on rules set by you in your Merchant Center account.
Creating rules will help you compete better as it will automatically minimize the prices, which will prevent underselling. You must set limits for a maximum price change (as a percentage or an absolute value) in the rule definition or an accurate minimum price.

Things to keep in mind:
You can learn how to create a pricing rule here.
As it is clear from its name, you can get an accurate look at the bestseller brands and products used in Shopping ads and Free Listings. It also gives you a report on whether or not you have included them in your product feed. Further, the bestseller report data is updated daily, which makes sure it is even more accurate.
You should have “Market Insights” enabled in your Merchant Center. This report is accessible to retailers who use Shopping Ads, Free Listings, or/and Buy On Google. Keep in mind that it does not include used products’ reports.
Head over to your Merchant Center account, and in the left-hand navigation panel, under the “Growth” section, you can find the “Bestsellers.”
Popularity rank: Based on the approximate number of units sold, the item’s popularity rank on Shopping ads and free listings is determined.
Popularity change over the last seven days: Trend of the in products’ popularity rank from the previous week.
Relative demand: The product’s demand is estimated by looking at the products’ demand concerning the product with the highest popularity rank in the same category and country.
Image: A sample image of the product.
Brand: The product’s brand.
Title: A sample title for the product.
Category: The Google product category that the item belongs to on Shopping ads and free listings.
GTIN: The most popular GTINs, as provided by merchants, are associated with this product in Shopping ads and free listings.
Brand inventory status: Notates whether the brand is currently “in stock” in your feed across multiple countries or “not in inventory.” This field doesn’t take the best sellers’ report country filter into account.
Product inventory status: Notates whether the product is “in stock” in your product feed across multiple countries, “out of stock” in your product feed, or “not in inventory” at all. This field doesn’t take the best sellers’ report country filter into account.
Price range: This displays the price range for the product in Shopping ads and free listings. These values do not include shipping costs.
Popularity rank: Based on the estimated number of units sold for this brand, its popularity in Shopping ads and free listings in the selected category and country are calculated.
Popularity change over the last seven days: The change in the brands’ popularity rank from the previous week.
Relative demand: A brand’s estimated demand concerning the brand with the highest popularity rank in the same category and country.
Top products:
Number of products in the “Top Products” tab associated with that brand. The link redirects to the top products tab, where you can see the complete list of specific top products for that brand.
Top products in your inventory:
Number of the brand’s top “in stock” and “out of stock” products that currently exist in your product feed for the selected country and category.
“In stock” and “out of stock” status is based on your inventory across all target countries for your Merchant Center account.
If you’re a seller selling products in many categories: Consider searching for results based on a high-level Google product category, like “Media” or “Home & Garden.” You’ll better understand product popularity because the results will include products from all sub-categories within the category you chose.
If you’re a seller selling in a specific category: Consider searching for results based on a narrow Google product category, like “Apparels > Female apparel > T-Shirts.” You’ll get a denser understanding of product popularity in a specific category.
However, applicable for retailers that use Shopping ads, free listings, and/or Buy on Google only. Still, you can group this report by product category and country to help you decide which new products and brands to stock. This gives you more insights into which products you should include in your feed.
Applicable for only Shopping ads and free listings retailers. This report shows you which products and brands are in more demand, and you could optimize your bids and budget for more sales
Showcasing the best sellers on your website can help you bring more sales for the products or brands that are already in high demand. Also, it is only applicable for retailers who use Shopping ads, free listings, and Buy on Google.
So now you know how to beat your competition through a legit pricing strategy. But this strategy ain’t enough to beat your competition, and you will require much more than that. Head over to this guide filled with all the resources and steps you need to achieve that.
Be it setting a pricing strategy or winning with an error-free product feed, or a winning Shopping Ads campaign, and we have it all for you! Connect with a team of experts in the comment section.
Walmart Embraces Amazon MCF: A New Era of Cross-Platform Fulfillment for eCommerce
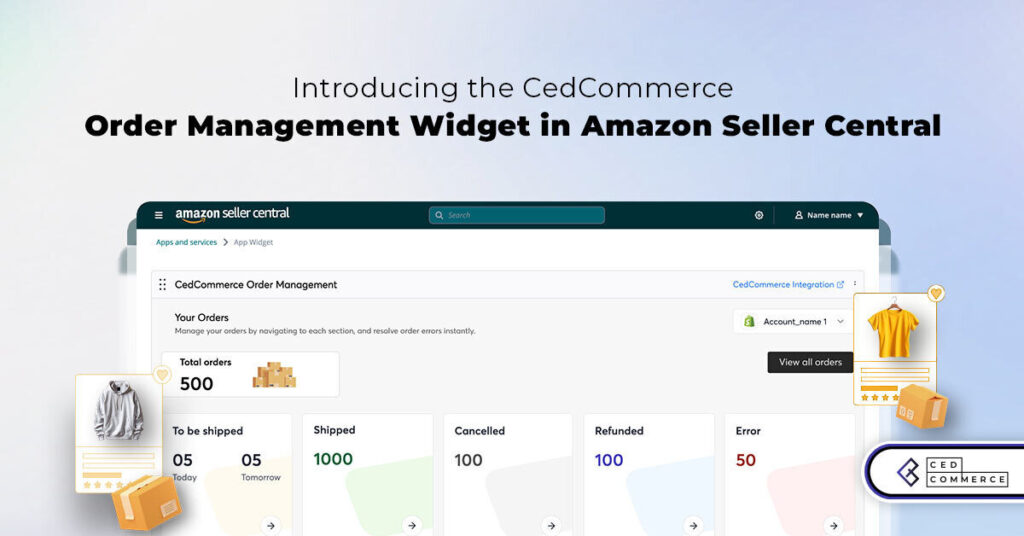
Order Management Redefined: A Centralized Solution for Amazon Sellers
Maximizing TikTok Shop’s Regional Compatibility for US, UK, and EU Markets
Understanding U.S. Tariffs in 2025: What Sellers Need to Know and Do
Walmart’s Search Algorithm Decoded: How to Rank Higher & Sell More
TikTok Gets a 75-Day Reprieve in the USA as Trump Signals Hope for a Deal

TikTok Shop Introduces Category-Based Benchmarks for Product Listings – What Sellers Need to Know
Amazon FBA vs. FBM: Which Fulfillment Method Is Right for You?
Amazon Launches Another AI Tool for Sellers: AI Generated Product Enrichment
Top 10 Selling Items on eBay in 2025
Amazon launches AI Powered ‘Interests’ Feature to Improve Shopping Experience
Is TikTok Staying in the US? The State of TikTok Ban
Best Buy coming back to the US, Marketplace Relaunch and New Opportunities in Store!

Miravia PrestaShop Connector: Built for Smart Sellers
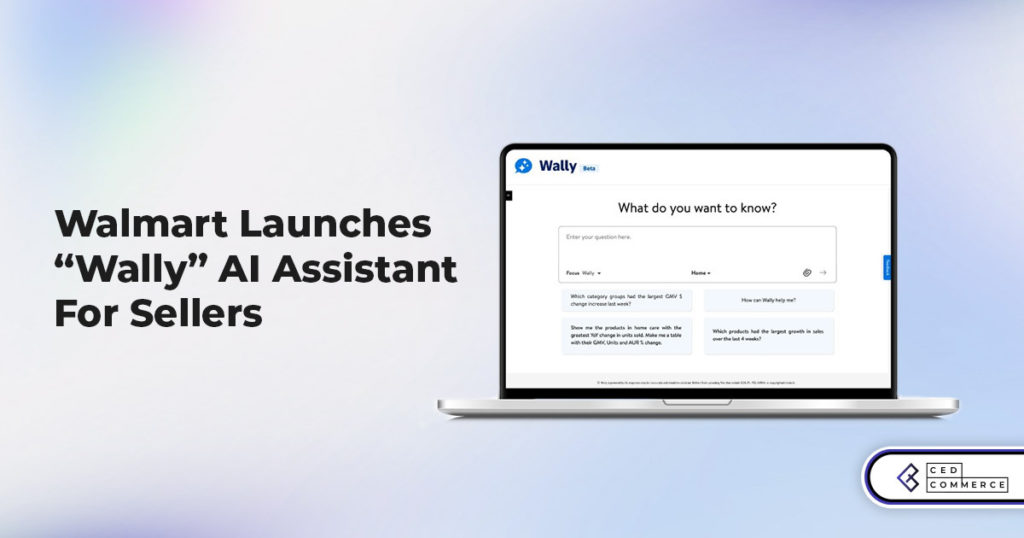
Walmart Launches “Wally”, AI Assistant For Merchants

TikTok Shop to Start Business in Germany, France, and Italy

TikTok Shop Surges as Americans Spend $700 Annually, Defying Regulatory Pressures
Amazon’s Longest Prime Day Ever: What You Need to Know
eCommerce Growth in the Netherlands: A 5% Surge in 2024 with Bright Prospects Ahead
CedCommerce Launches Shopee & Lazada Integration for WooCommerce on WordPress.com