Walmart Embraces Amazon MCF: A New Era of Cross-Platform Fulfillment for eCommerce
Walmart Embraces Amazon MCF: A New Era of Cross-Platform Fulfillment for eCommerce

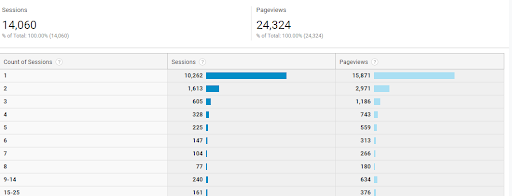
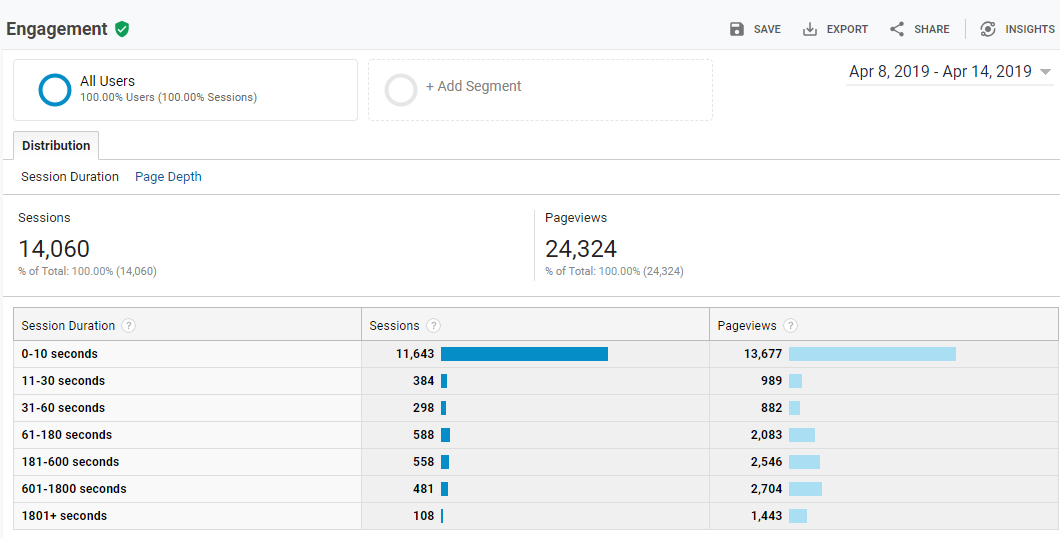
Google analytics is one of the most powerful web analytics tools by Google which can be used to track website activity such as session duration, pages per session, bounce rate, etc.
Google Shopping Actions US is open for Merchants in India and Canada: Start selling cross-border to customers in the US, from either India or Canada without any fuss, right away.
It uses a website tracking code to collect data from your website such as website visitors and how they interact with your website.
By using google analytics, you can have an in-depth look of your website and know all the statistics of your website.
1) The Dashboard:
By analysing the metrics present on the Google Analytics Home Page (Dashboard), one can have a clear view of the popularity of his website.
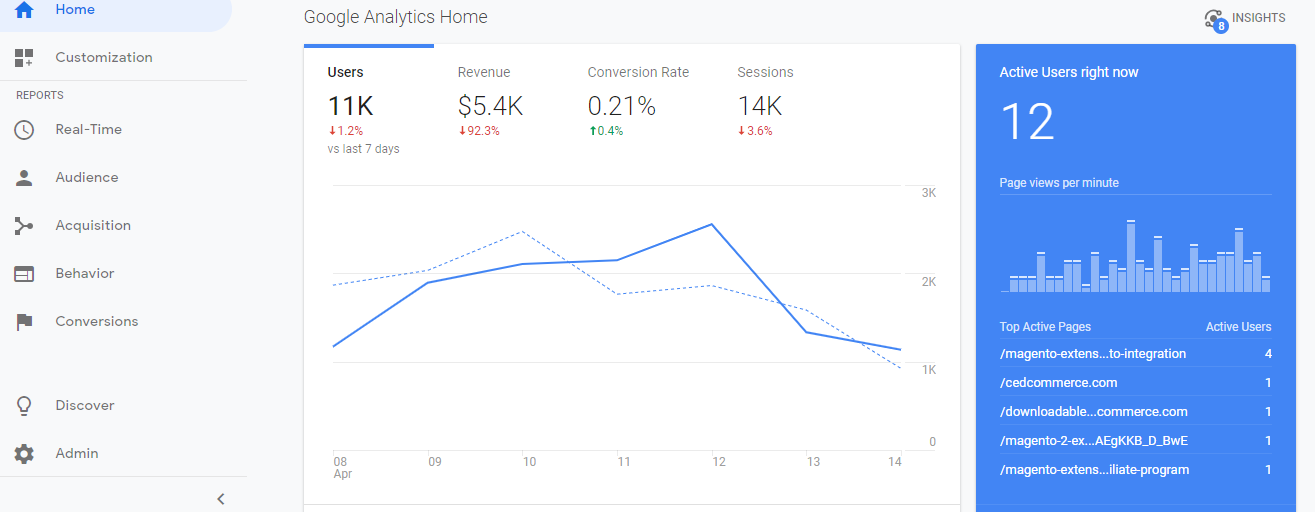
i) Google Analytics Home- The Google Analytics Dashboard is a storehouse of all the statistics relevant to your website.
a) Users: You can have a look upon the number of your website users of last 7 days, 14 days, 28 days and so on. Below this number, the dashboard also displays a comparative percentage (increment/decrement) since previous number of days selected by you.
b) Revenue: This displays the money earned through the website.
c) Conversion rate: This depicts the percentage of prospects closed as leads.More clearly this is the number of conversions divided by the total number of sessions multiplied by 100.
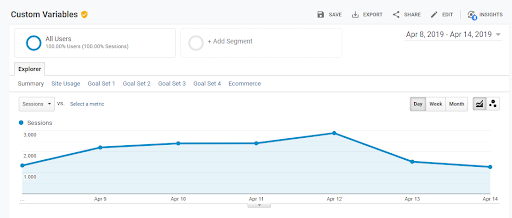
d) Sessions: This section tells you about the number of activity done per visit by a user.
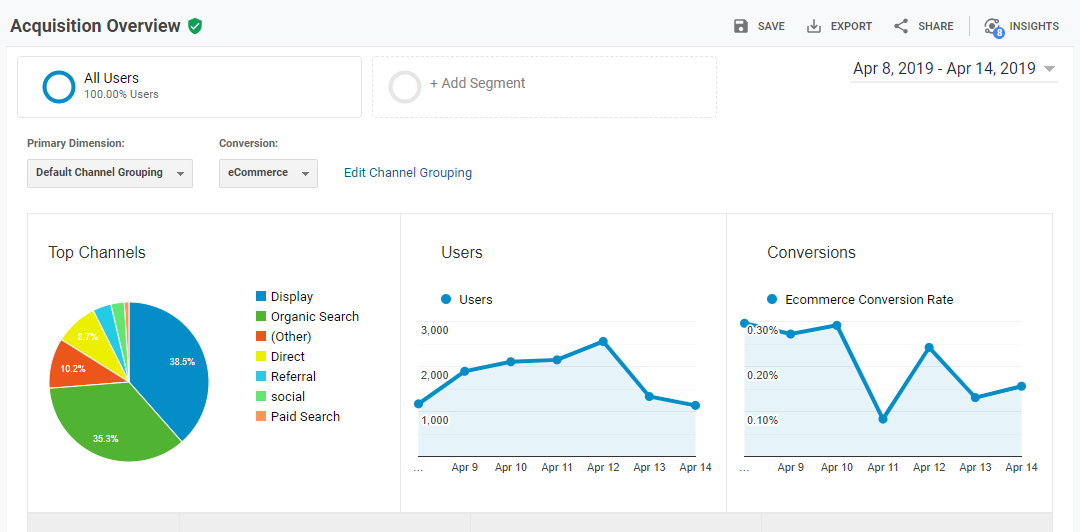
ii) How do you acquire users?
This section of Google Analytics gives a record of number of users gained through different mediums as mentioned below:
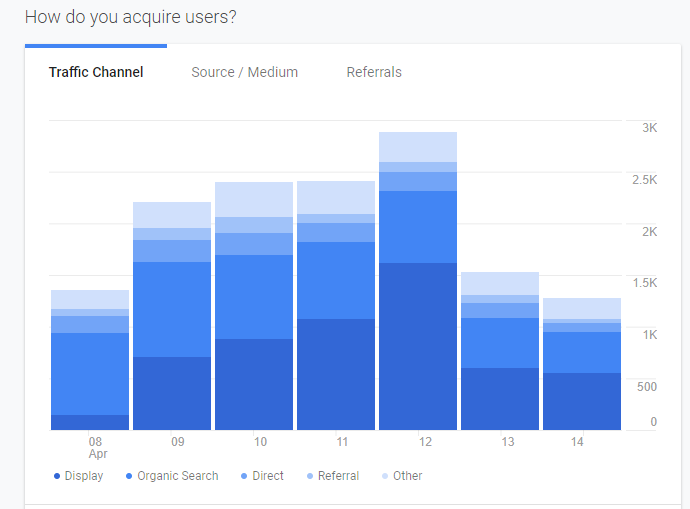
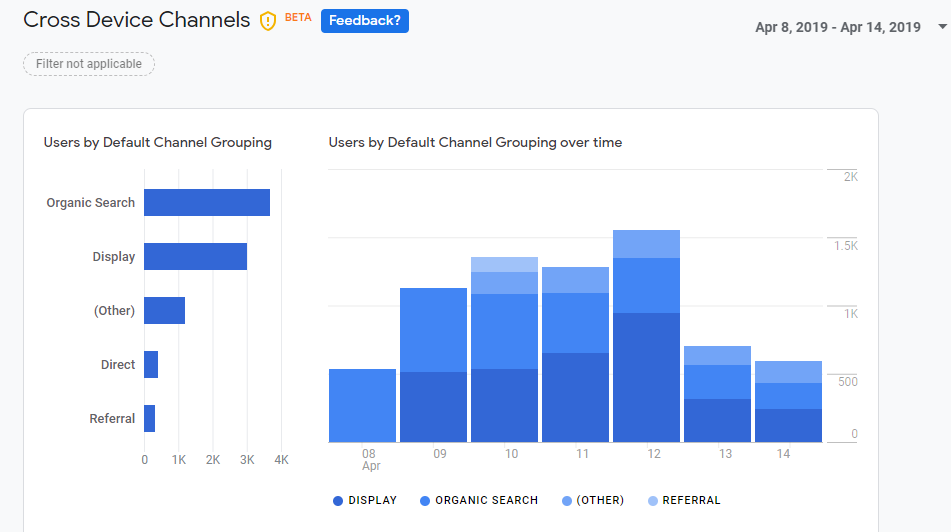
a) Traffic Channel- This includes the various ways through which the traffic is acquired by your site. This section represents the information in graphical format.
This can be through organic search (direct google search), display ads(google ads), direct (on website), referral( quora, fb, twitter, etc) & others (marketing campaigns).
b) Source/Medium- Source is the origin of your traffic, such as search engine or a domain.
Medium is the general category of your source such as organic search, cost-per-click-paid search(cpc), web search, etc.
c) Referrals- This reports you about the traffic acquired through various social media platforms or other websites.
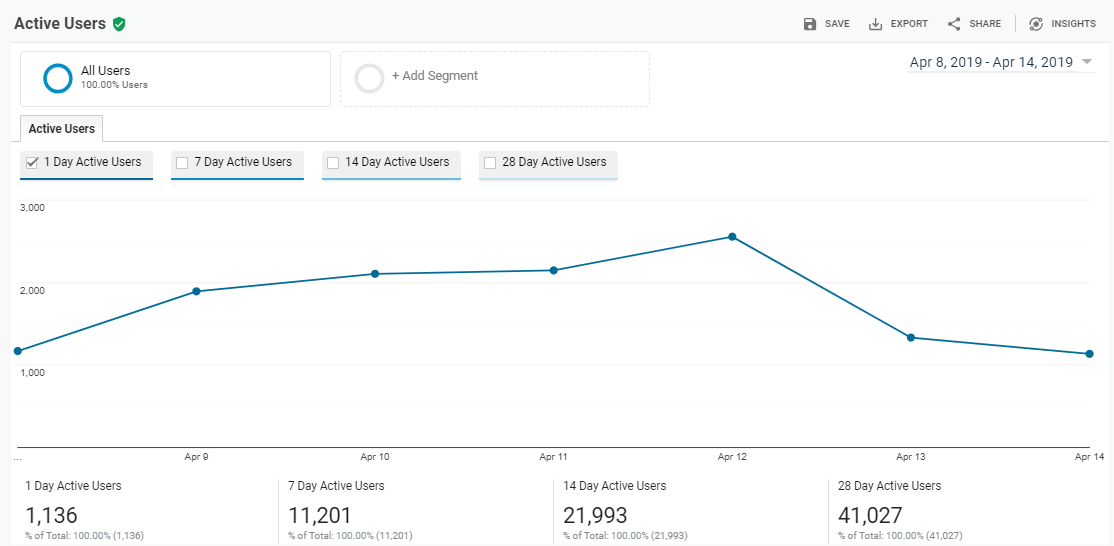
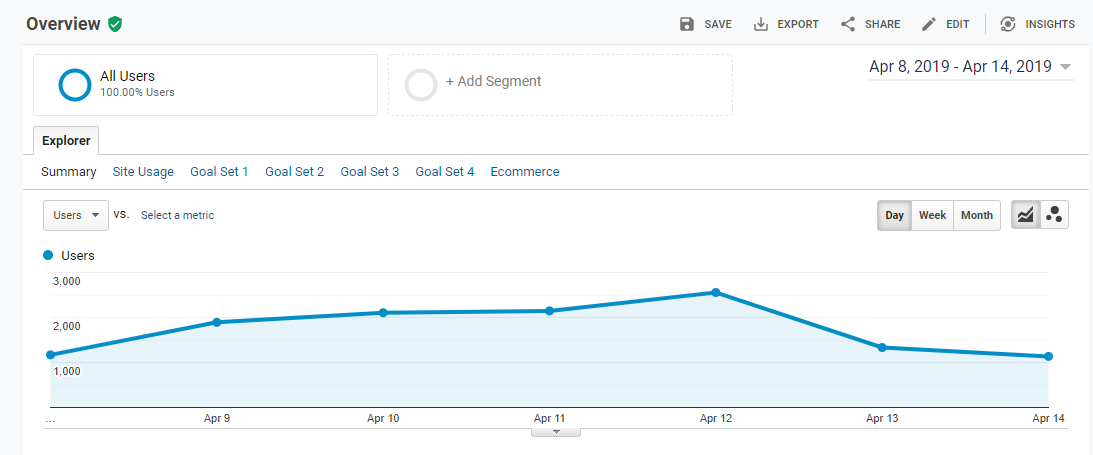
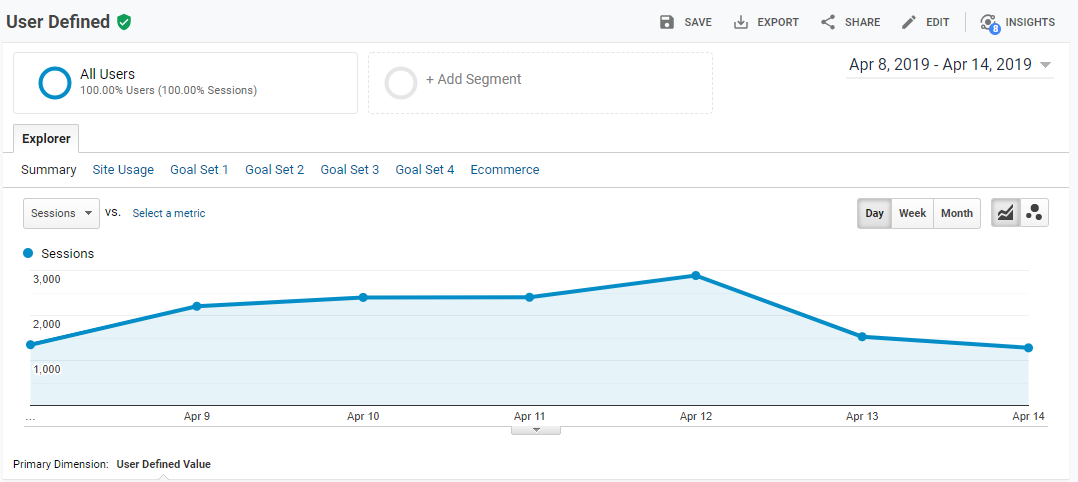
iii) How are your active users trending over time?
This gives you a clear insight into the pattern followed by your active users.
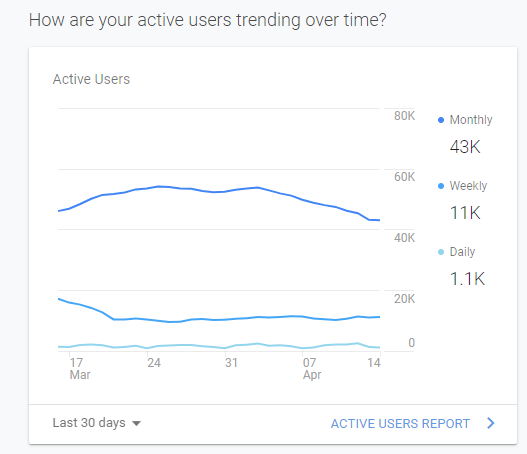
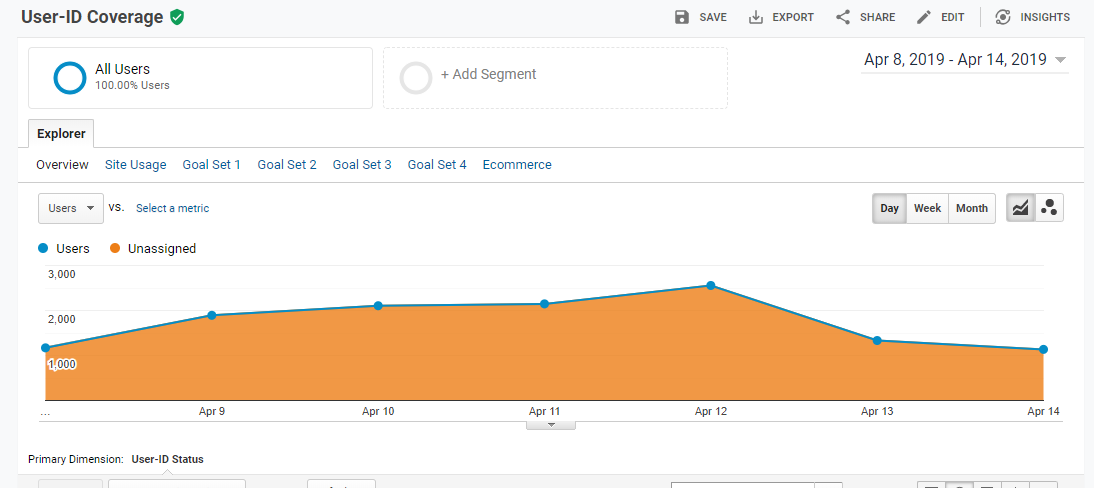
Active Users Report: You get to see the graphical analytics of the number of your daily, monthly & weekly active users (You can freely choose the duration you want to see results for).
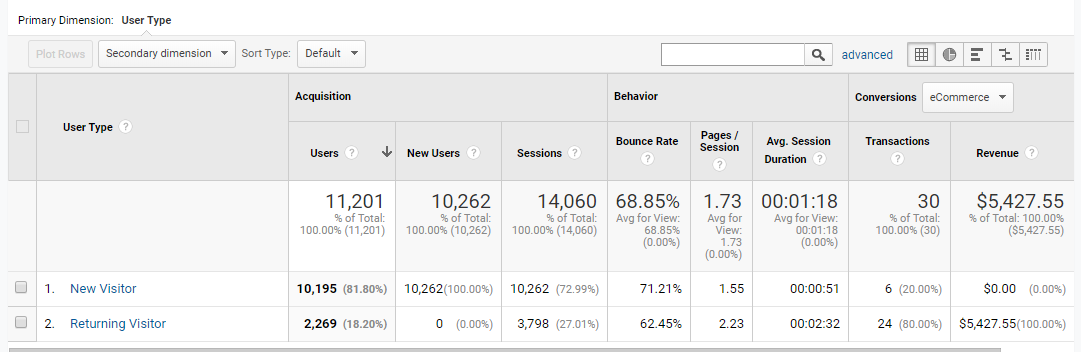
iv) How well do you retain users?
This tells you about the returning visits of your users. Thus, one can easily know what works for his website and what doesn’t.
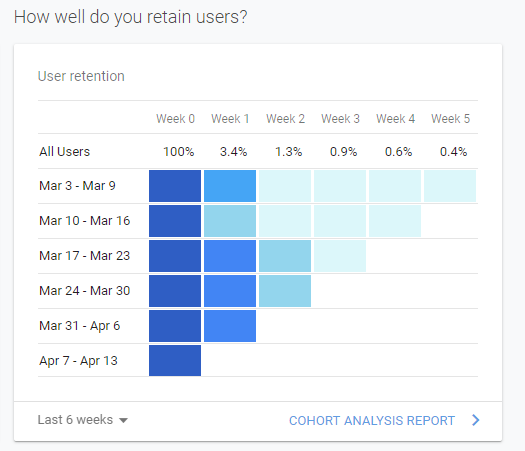
This section displays a User Retention Bar Graph displaying the percentage of users re-visited your site. You can choose the duration for which you want the data to be retrieved.
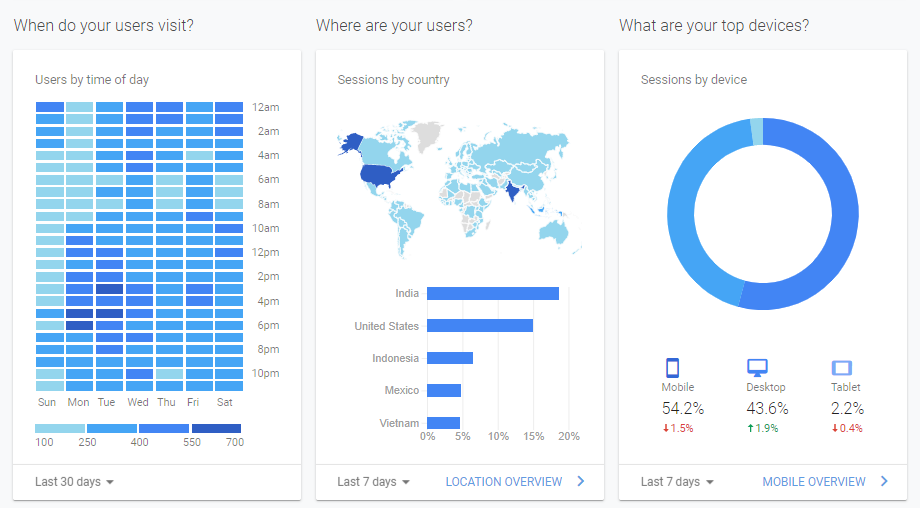
v) When do your users visit?
This section presents a statistical data of activity on your website corresponding to different times of the day. This can help you to plan your campaigns accordingly to have the maximum traffic.
Analysing this report can give a fair idea about the time your social media posts should mostly go live at.
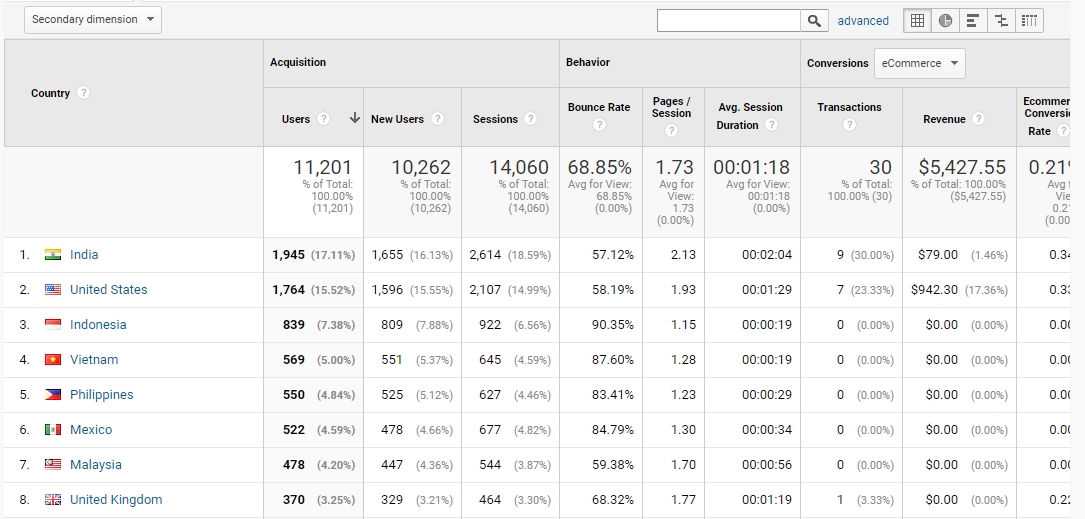
vi) Where are your users?
This presents the countries your users are based out of. The percentage of users of your website present in a country.
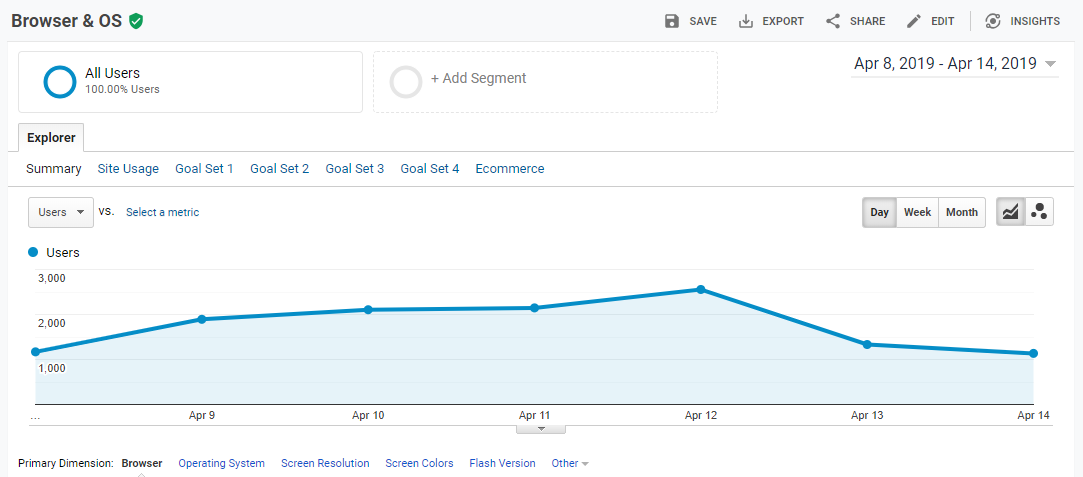
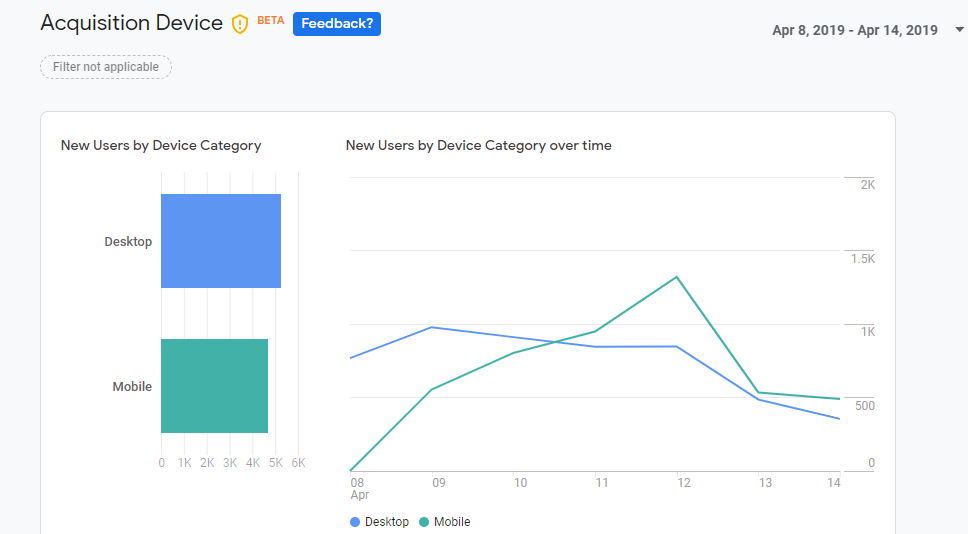
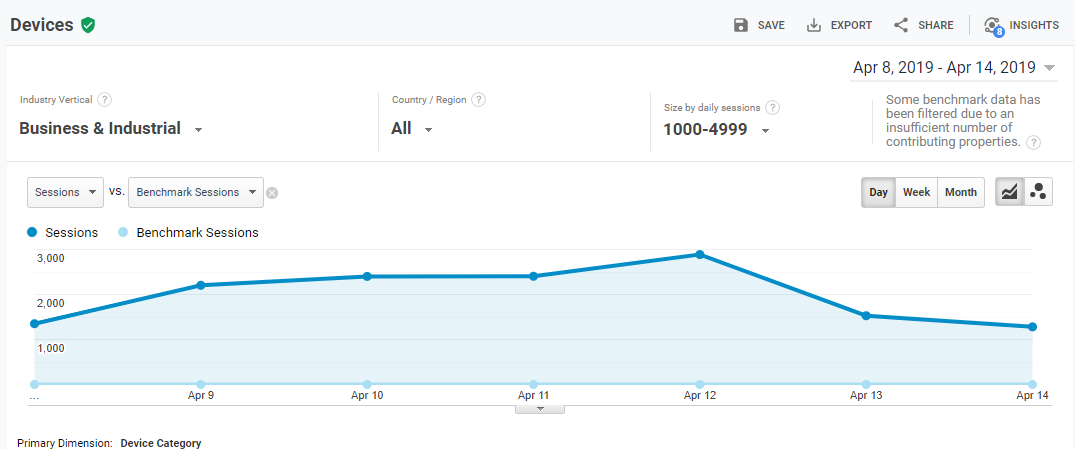
vii) What are your top devices?
This presents the percentage of users visiting your website through desktop, mobiles & tablets.
viii) What pages do your users visit?
This displays the web pages frequently visited by users. This even shows pageviews & and amount earned through each page (Page Value).
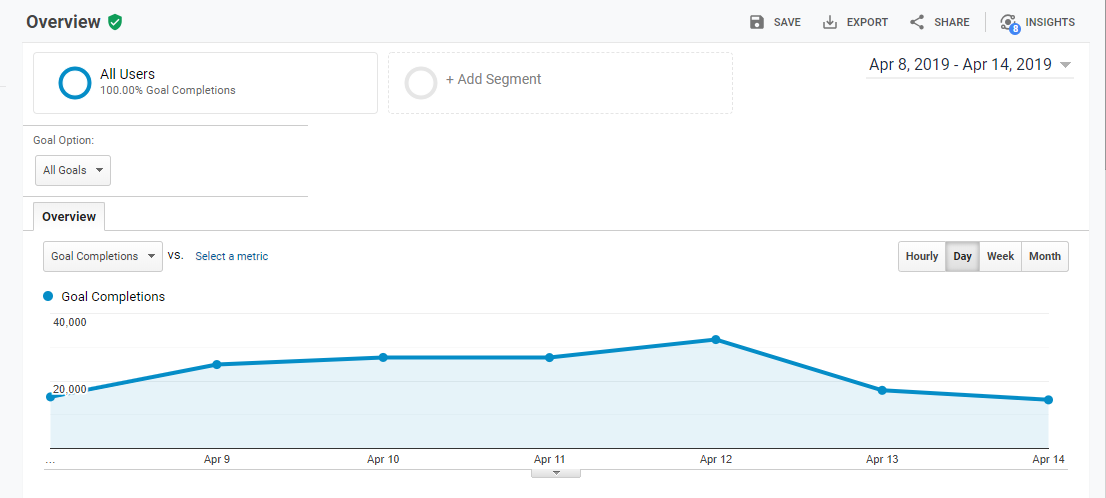
ix) How are you performing against your goals?
Google Analytics presents the number of the goals completed by you (goals refers to aims set by you for your product or landing pages.) The goal funnel helps you to figure out the stage at which a visitor leaves out your page.
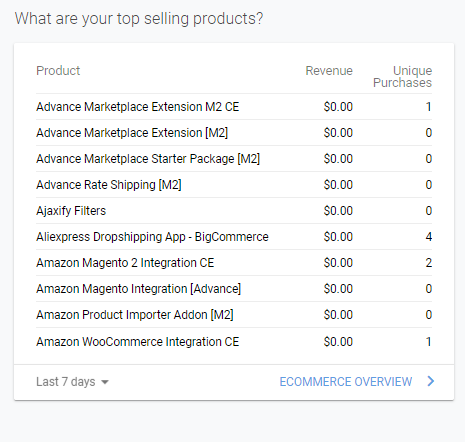
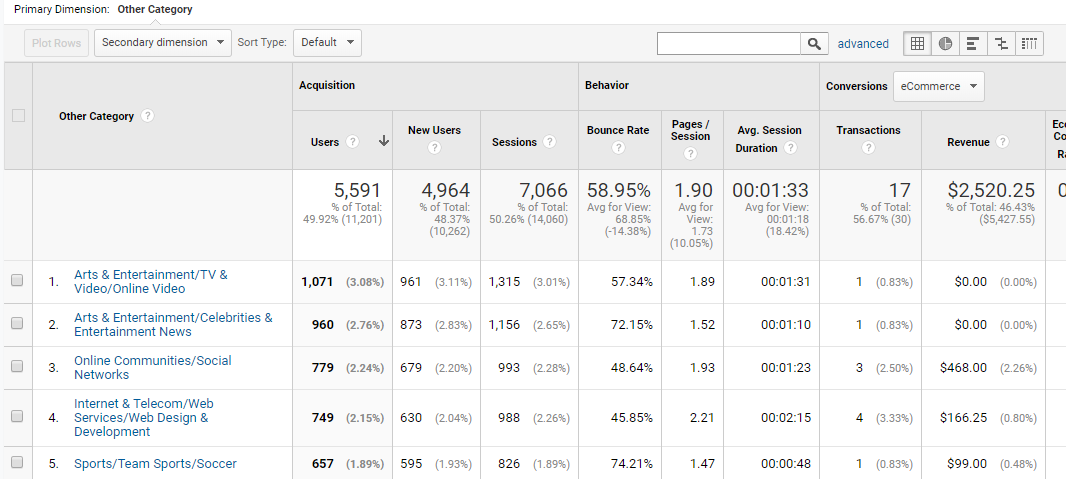
x) What are your top selling products?
Google Analytics allows you to list the products you sell & this section allows you to analyse the best-seller products, its revenue & unique purchases (product bought by first-time website visitors).
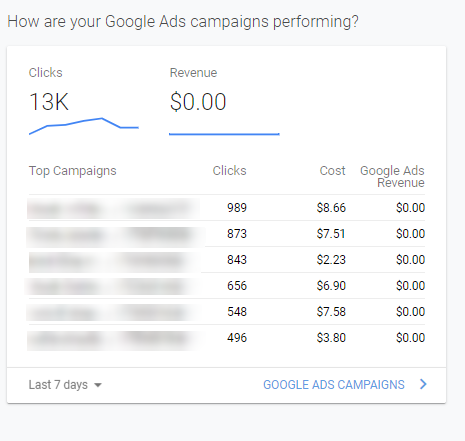
xi) How are your Google Ads campaigns performing?
Google Ads have become a great source of gaining traffic for your website hence this section provides an insight into your Google Ads such as click & revenue generated from it.
2) Customization:
This section shows the details about your website such as Customised Dashboard, Custom Reports, Saved Reports, Custom Alerts.
This section is dedicated to having self-created records of your website.
3) Reports:
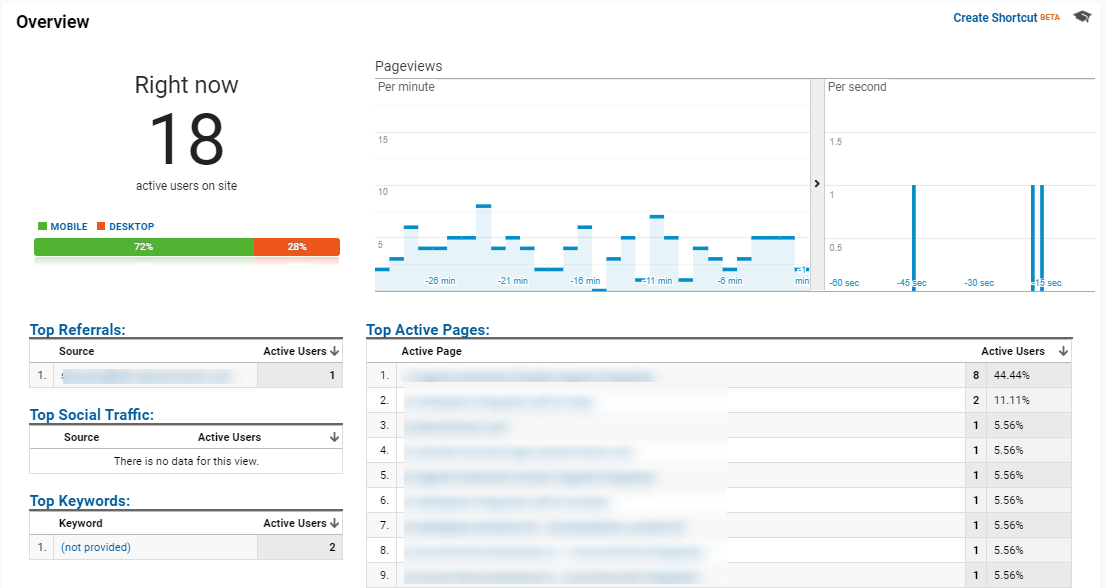
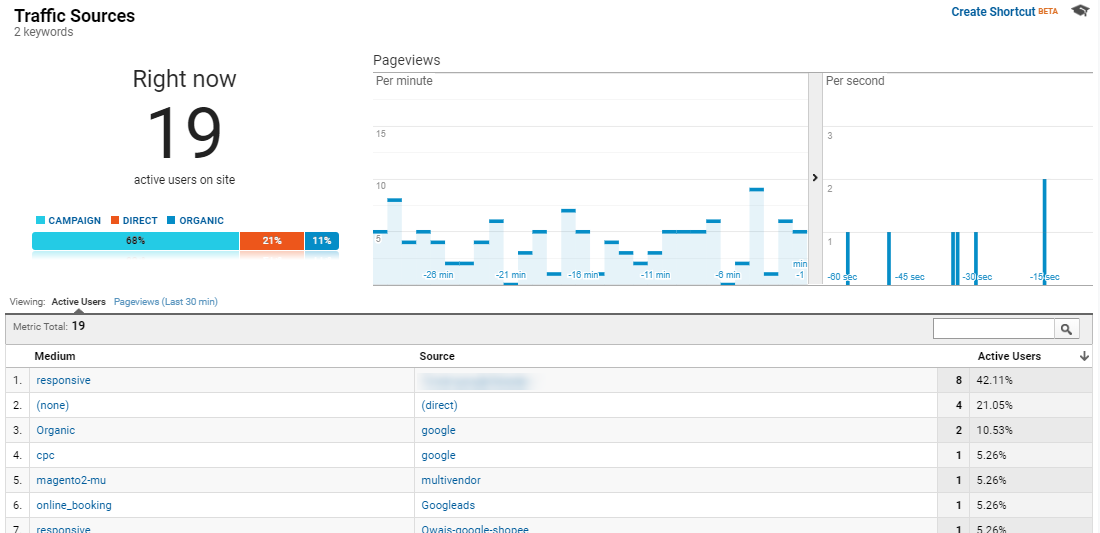
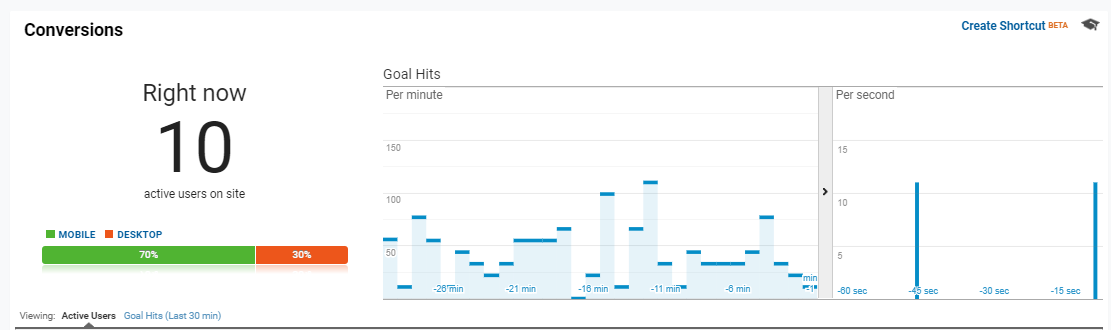
i) Real-Time (screenshot): It displays the data about traffic sources, events, content & conversions of your website.
Let’s have a look at the sub-sections of the Real-Time section:
a) Overview: See your website traffic through Source/Medium, referrals, etc. You can also see your top performing pages.
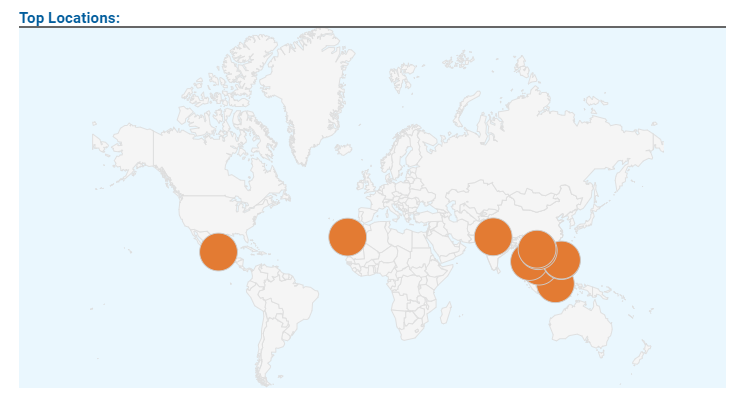
b) Locations: Have a clear vision of which locations contribute the maximum to your website traffic.
c) Traffic Sources: Know the cause of origin of your traffic.
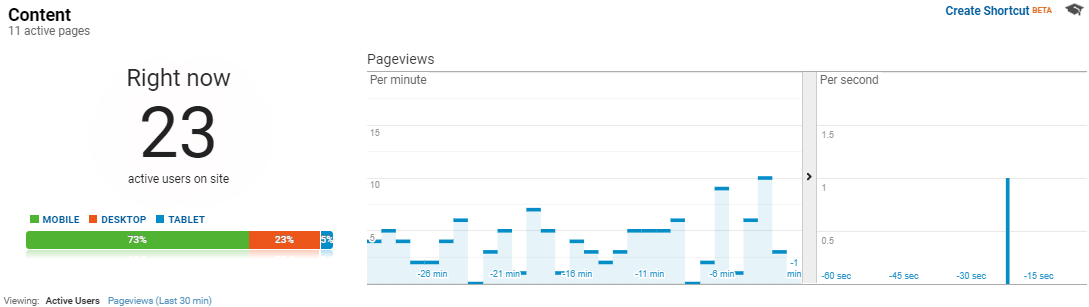
d) Content:
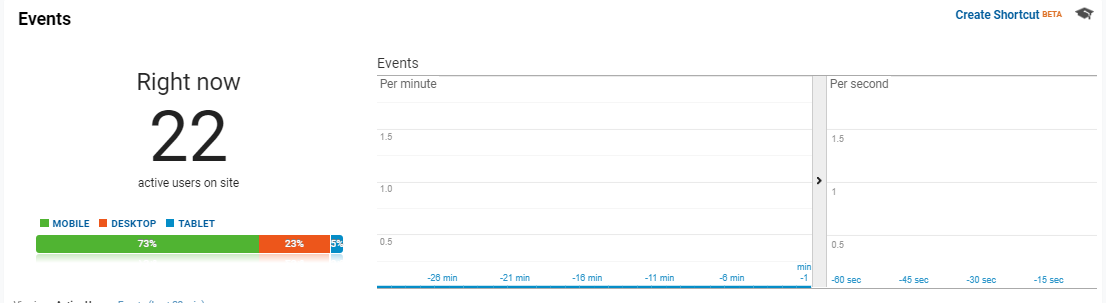
e) Events:
f) Conversions:
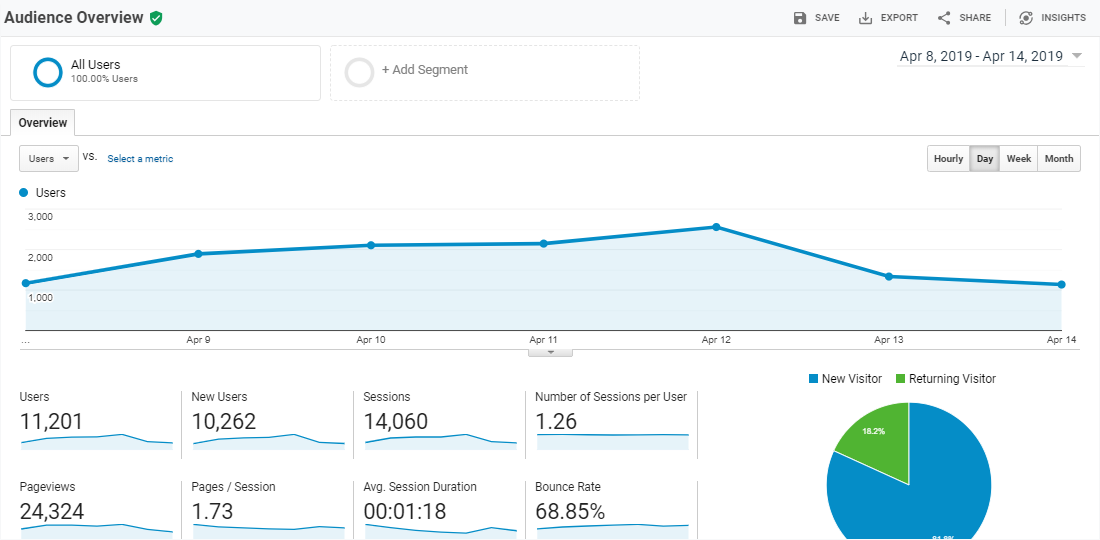
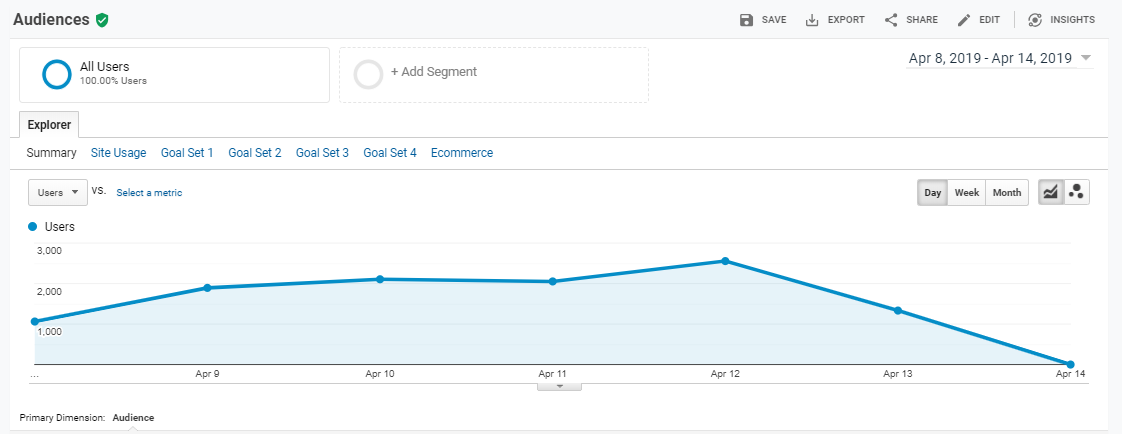
ii) Audience: This sections provides an insight into your customers as in the active users, Lifetime Value, Cohort Analysis (details about the customers similar in behavior), demographics, devices, etc. It even imparts comparative analytics against your previous business days & industry as well.
a) Overview: Know about your active users , number of sessions in a particular time range, average session duration, etc.
b) Active Users: Know the number of active users on your website in a day, 7 days, 14 days & so on.
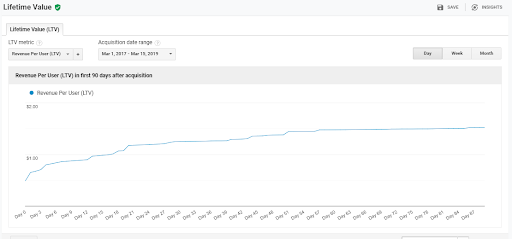
c) Lifetime Value: Predict the relationship with your customers in the future & plan accordingly.
d) Cohort Analysis: Analyse the customers exhibiting same behavior & page visit trends.
e) Audiences: Know your audience and the site usage by your audience.
f) User Explorer: Know the average page session duration, bounce rate, revenue, transactions, etc. You can also create customer segments for easier traffic analysis.
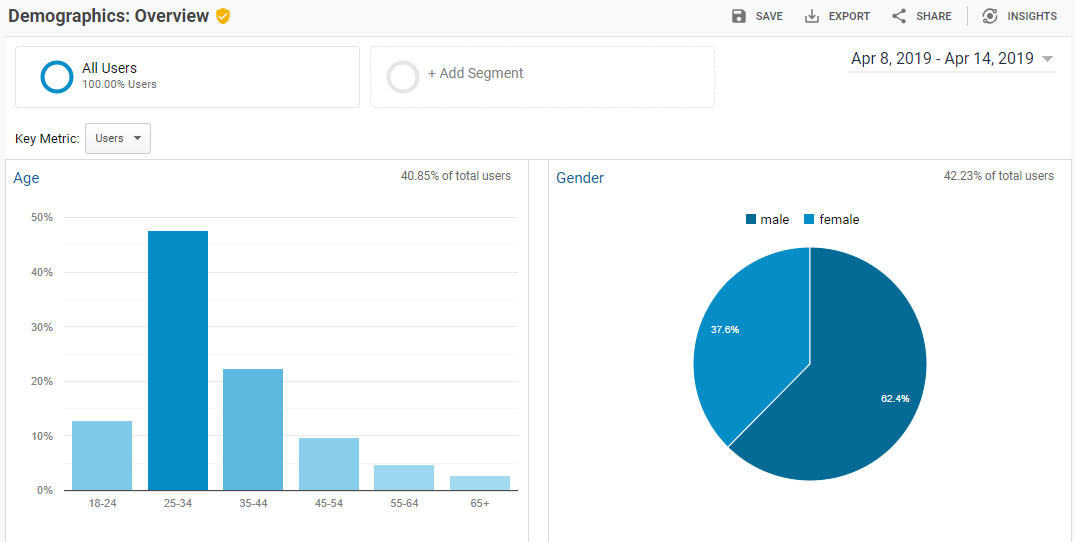
g) Demographics:
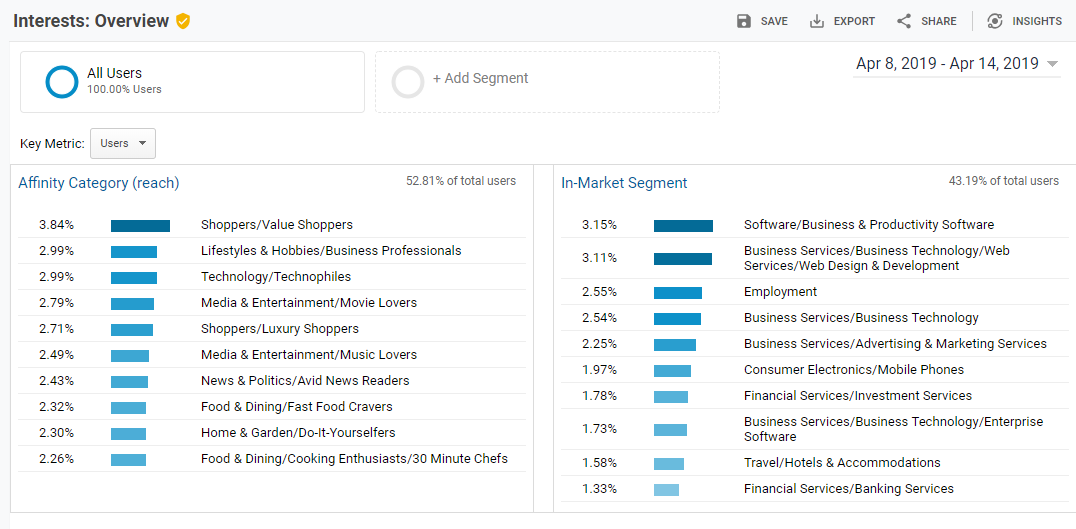
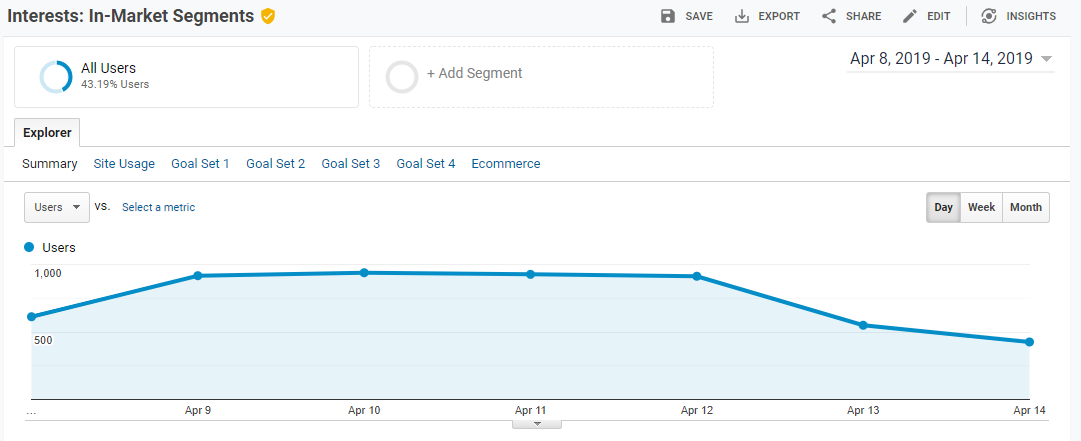
h) Interests: Know the top interests of your users.
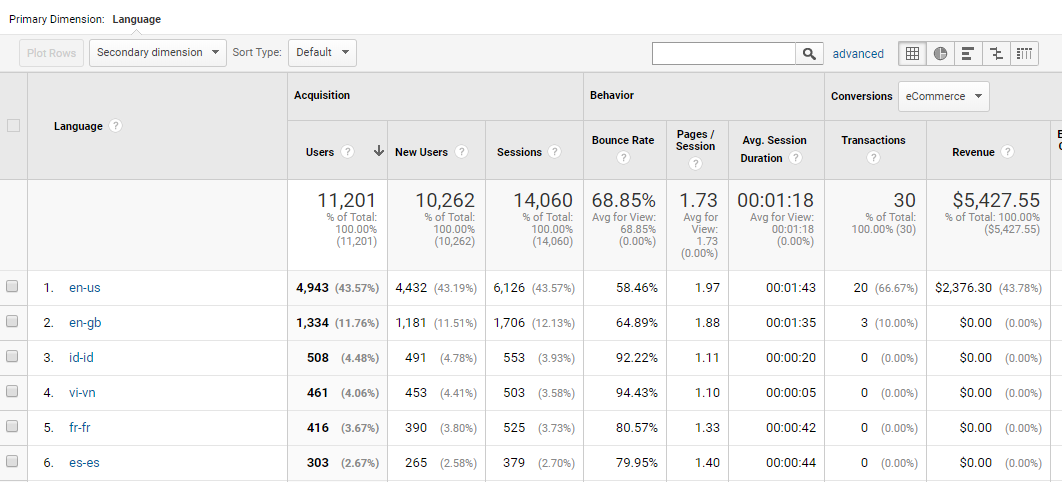
i) Geo: Know the locations you fetch your most traffic from. This section also helps you to identify the language in which your visitors browse. This gives you a fair idea of how to have a well-strategic approach.
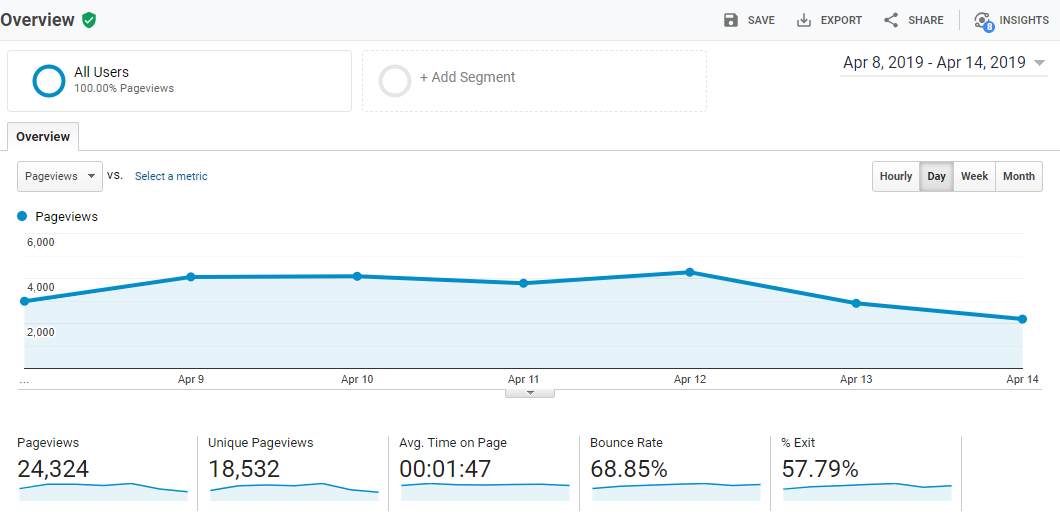
j) Behavior: Know the course of your visitor journey on your page. This section displays unique page views, average time spent by visitors on your website, bounce rate, exit rate, etc. You can also see the page views on your blog pages to know what kind of content actually works.
k) Technology: Explore about the browser used by most of your active users. This will help you to optimise your web pages accordingly.
l) Mobile: Get reported about the mobile handset names used by the visitors of your site.
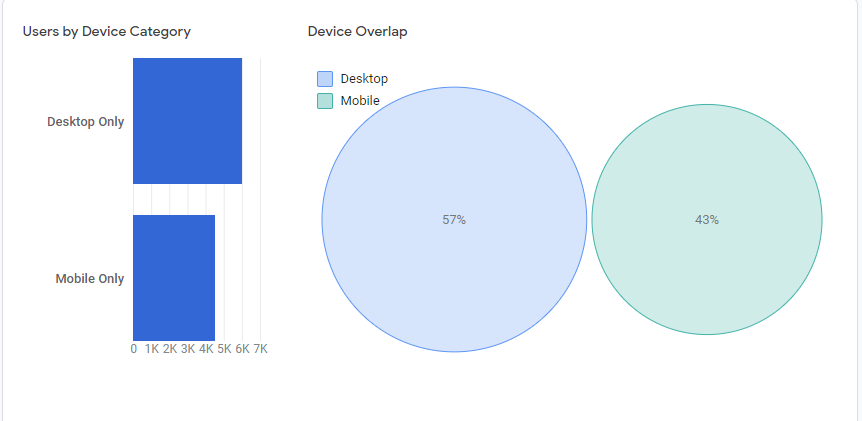
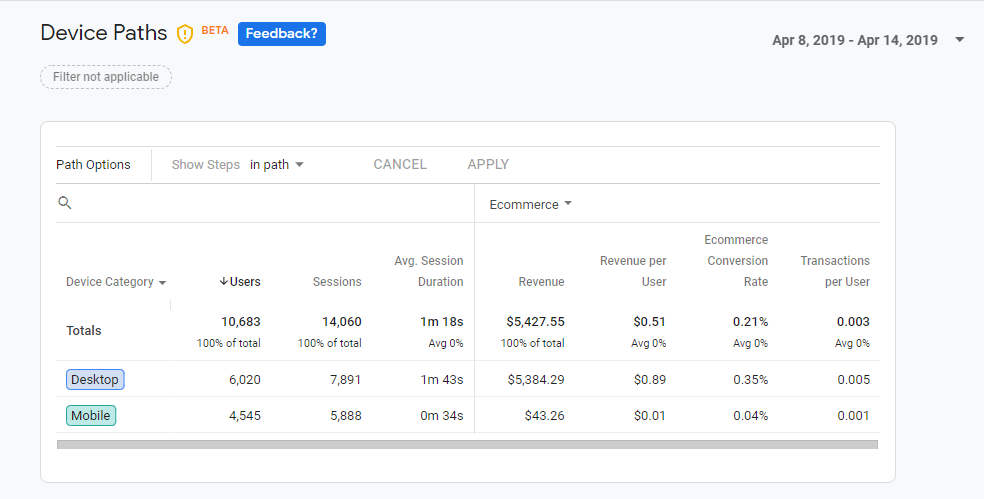
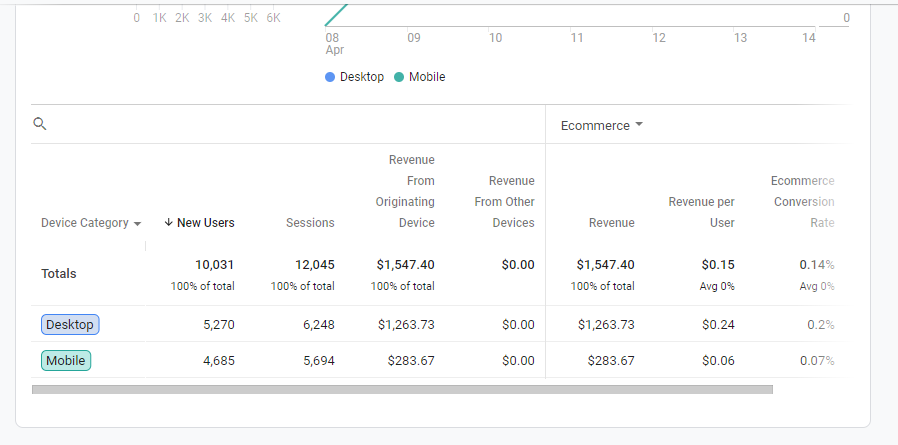
m) Cross Device: Get an insight into how people visit your website across mobile phones, tablets & other devices.
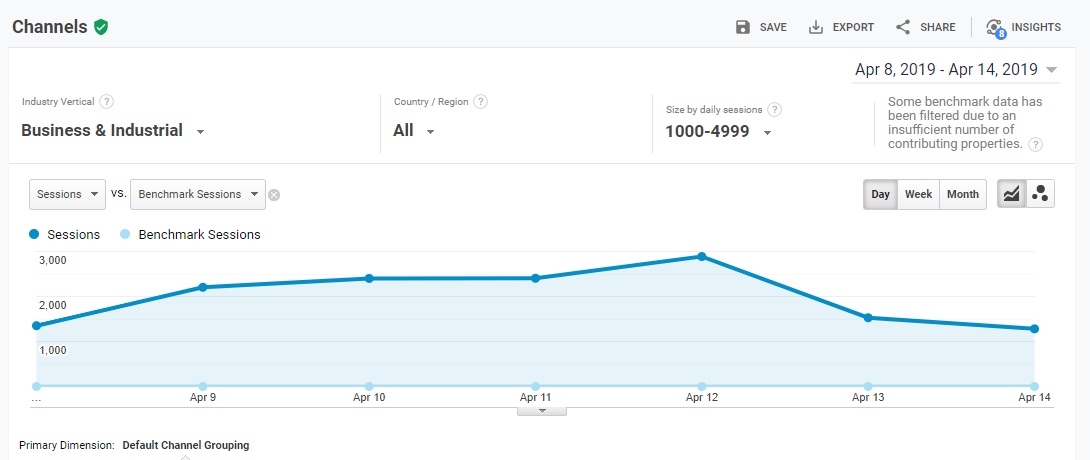
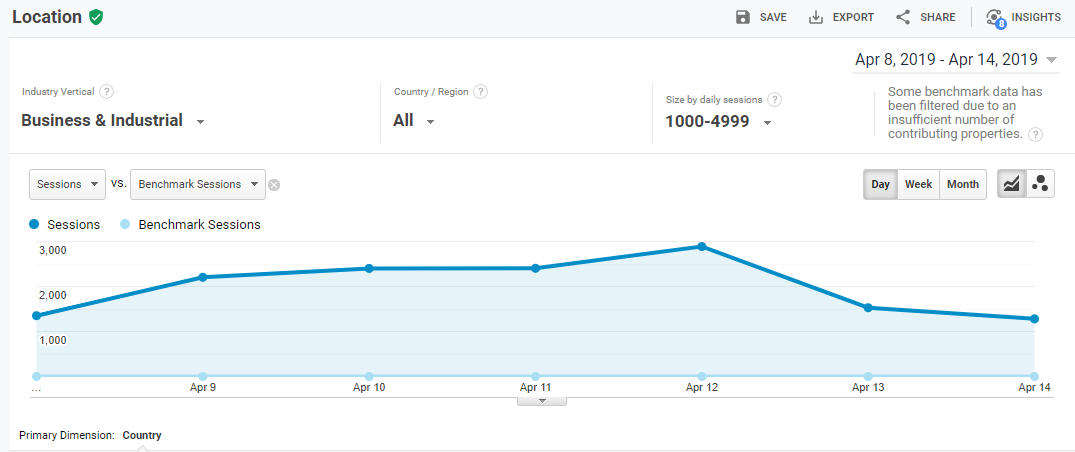
o) Benchmarking: Benchmarking allows you to compare your data with aggregated industry data from other companies who share their data.
Channels: You can view the platform from where you receive traffic on your website.
Locations: Know the location of your active users.
Devices: View devices used by your active users.
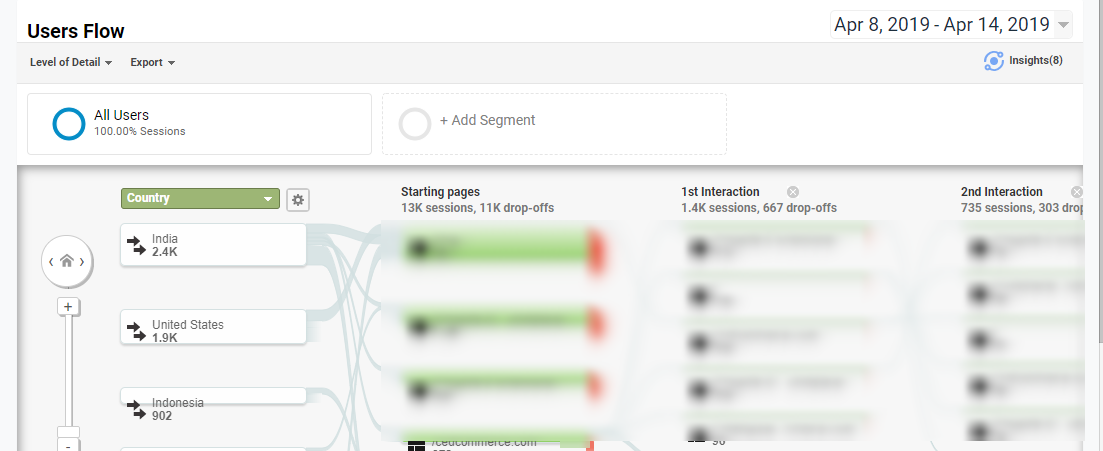
p) Users Flow: Track the path followed by users while accessing your website.
iii) Acquisitions: Get to know where your visitors originated from (search engines, social networks, referrals, etc).
iv) Behavior: Know how the visitors access the web pages of your website. Explore unique page views, Bounce rate, etc. to see how your page performs.
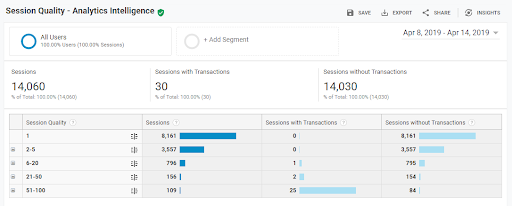
v) Conversions: Identify the conversion rate of your site by analysing goal completions, etc.
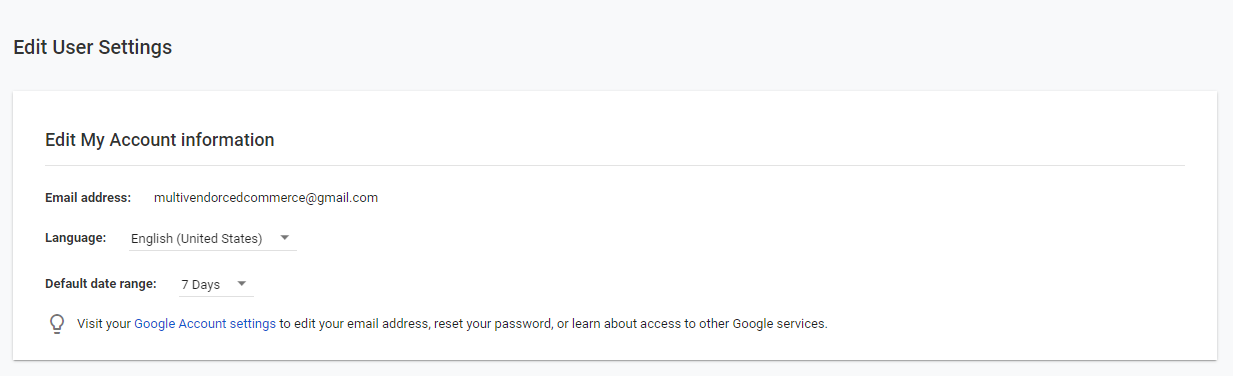
4) Settings- Update your account settings, property settings, tracking info, etc and use Google Analytics in a personalized way.
5) Top Menu Bar-

You can search your campaigns, pages to be analysed, notifications, etc from the Top Bar.
Click to Know How to set up Google Analytics (for your website) ?
1) It is completely free of cost- The Google has kept this tool to be completely free, despite the functionalities that it offers.

2) Helps you know website visitors in great detail: Google Analytics helps to discover location, demographics, frequency, behavior, etc. of the users of your website so that marketing strategies and campaigns can be planned accordingly to get maximum conversions.

3) Measures your goals: Google Analytics studies the flow of the user visits on your website. It then, presents a comparative data of the user visit against the aspired goal funnel set up by you on Google Analytics.

4) Visitor Segmentation : With its Cohort Analysis feature, Google Analytics helps to present data of similar customers together, which lets you create targeted strategies.

5) Calculate the success rate of your website: Google Analytics helps you to know how your website is performing in the industry. You can know the relevant parameters such as bounce rate, impressions, page views, etc.

1) Goal Set-Up: Shopify sellers can initiate goals to estimate the performance of their Shopify pages.
One can set the following types of goals:
i) Destination
ii) Duration
iii) Pages/screens per session
iv) Event
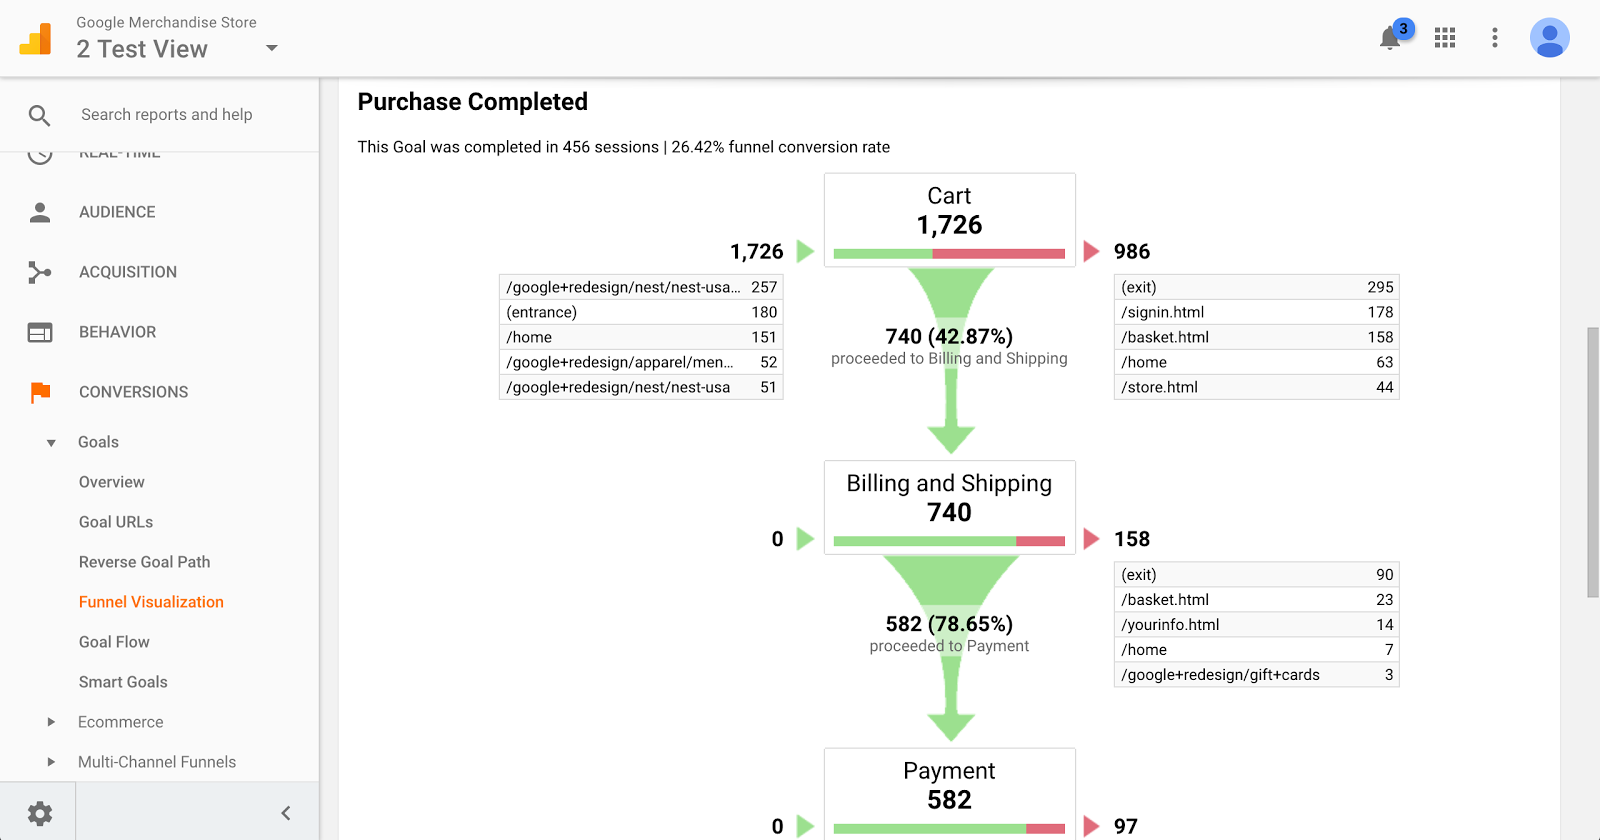
Goal Funnel Visualization: This feature of Google Analytics helps to view the path followed by an active Shopify visitor.
2) Enhanced eCommerce Tracking Code: The enhanced eCommerce plug-in for analytics. It enables the measurement of user interactions with products on ecommerce websites across the user’s shopping experience, including: product impressions, product clicks, viewing product details, adding a product to a shopping cart, initiating the checkout process, transactions, and refunds.
The tracking code, once properly set-up, can help you analyse the following for your Shopify store:
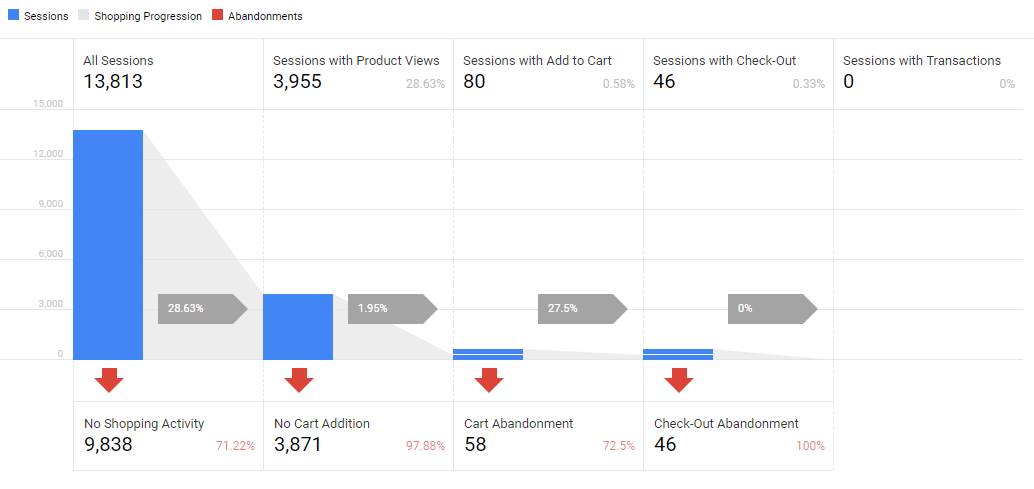
i) Shopping Behavior: You can view number of Shopify abandoned carts, check-out abandonment, no shopping activity, etc.
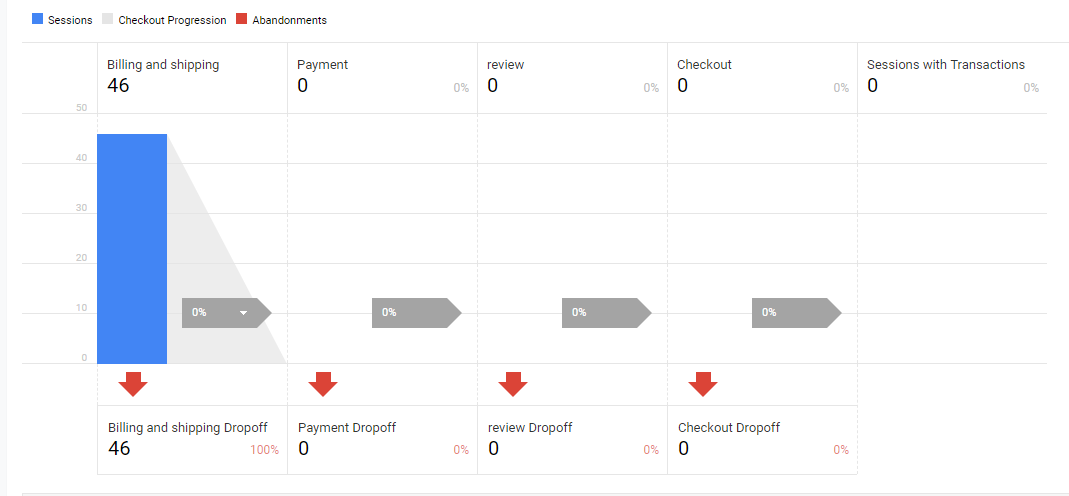
ii) Checkout Behavior: View Shopify shipping, billing drop-offs, payment drop-offs, etc.
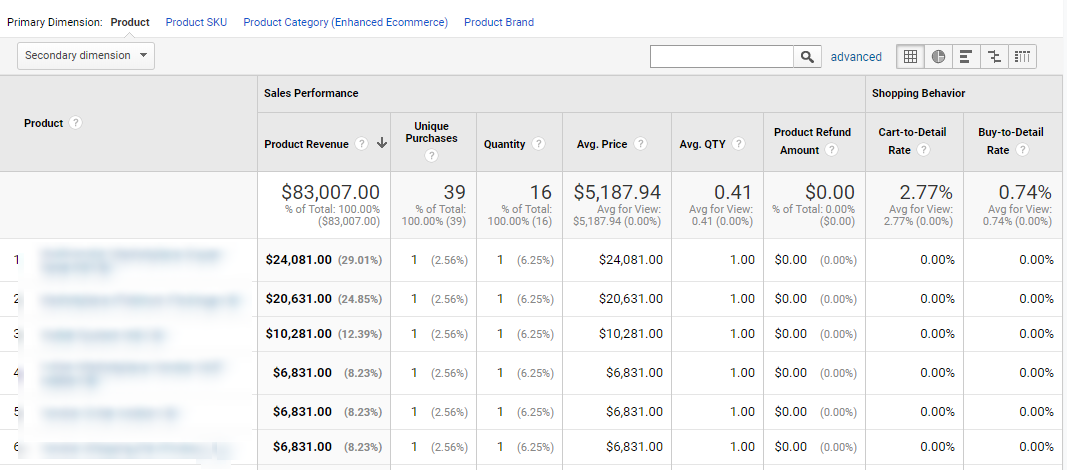
iii) Product Performance: View your Shopify product unique purchases, product revenue & other relevant details.
iv) Sales Performance: Know overall product revenue generated, revenue achieved from product shipping, etc.
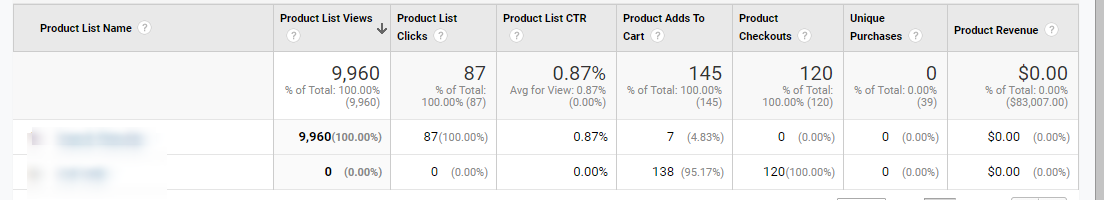
v) Product List Performance: Check the Shopify product list views, click-through rate, checkouts, etc.
Use Google Analytics to:
1) Run your website in a targeted manner.
2) Generate more ROI
3) Track your audience
4) Analyse your website’s performance
If you want to analyse Shopify store and check its performance, Google Analytics is the perfect go to for you.
In case of any inconvenience, feel free to drop in a mail with your query.
If you enjoyed reading this blog, do comment & share!

Walmart Embraces Amazon MCF: A New Era of Cross-Platform Fulfillment for eCommerce
Order Management Redefined: A Centralized Solution for Amazon Sellers

Maximizing TikTok Shop’s Regional Compatibility for US, UK, and EU Markets

Understanding U.S. Tariffs in 2025: What Sellers Need to Know and Do
Walmart’s Search Algorithm Decoded: How to Rank Higher & Sell More

TikTok Gets a 75-Day Reprieve in the USA as Trump Signals Hope for a Deal

TikTok Shop Introduces Category-Based Benchmarks for Product Listings – What Sellers Need to Know

Amazon FBA vs. FBM: Which Fulfillment Method Is Right for You?

Amazon Launches Another AI Tool for Sellers: AI Generated Product Enrichment
Top 10 Selling Items on eBay in 2025

Amazon launches AI Powered ‘Interests’ Feature to Improve Shopping Experience

Is TikTok Staying in the US? The State of TikTok Ban

Best Buy coming back to the US, Marketplace Relaunch and New Opportunities in Store!

Miravia PrestaShop Connector: Built for Smart Sellers

Walmart Launches “Wally”, AI Assistant For Merchants

TikTok Shop to Start Business in Germany, France, and Italy

TikTok Shop Surges as Americans Spend $700 Annually, Defying Regulatory Pressures

Amazon’s Longest Prime Day Ever: What You Need to Know

eCommerce Growth in the Netherlands: A 5% Surge in 2024 with Bright Prospects Ahead

CedCommerce Launches Shopee & Lazada Integration for WooCommerce on WordPress.com