
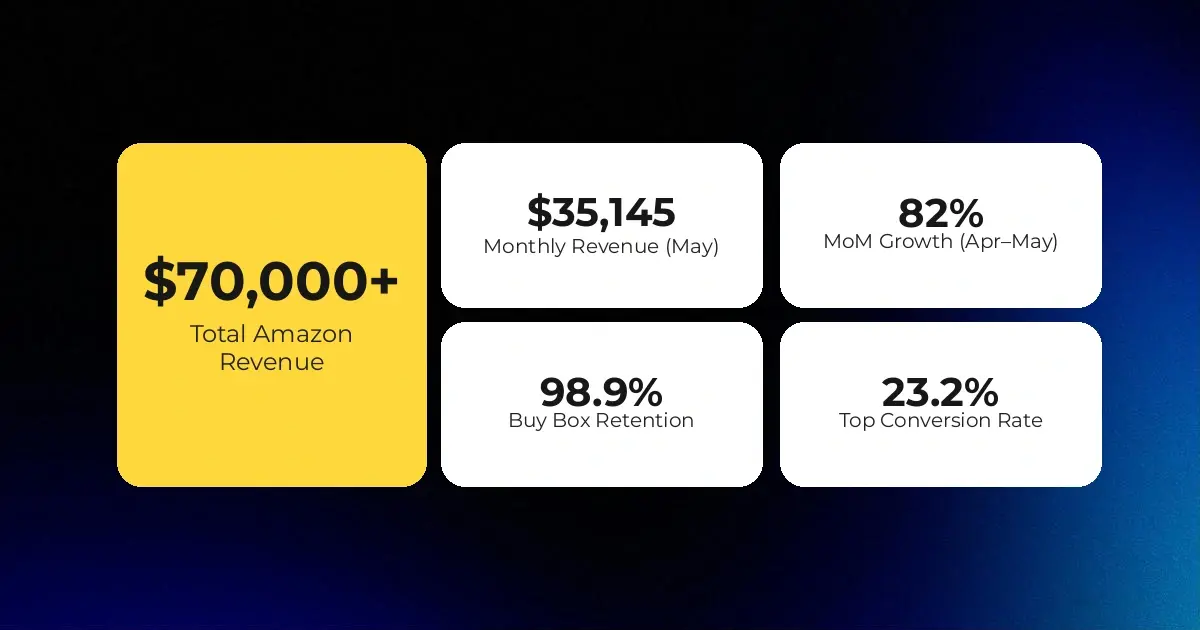
From $0 to $35K Monthly in Under 60 Days: How CedCommerce Built Milky Mama’s Amazon Channel
Reading Time: 3 minutes Section 1: About the Client Milky Mama is a leading maternal…
Running short of time? Get PDF of the blog in your mail.
With the rise of drop-shippers around the world, affiliate marketing has become the ideal pathway to promote products to potential buyers. This process helps dropshippers upsell their products along with highlighting their features and USPs without any additional upfront costs. CedCommerce has recently collaborated with Secomapp to open the doors for dropshippers from around the globe. They can effortlessly pay heed to their affiliate marketing needs for marketplaces like Shopify, Etsy, and others. In fact, the affiliate marketing dashboard can be used along with Shopify analytics to good effect, boosting your sales.
From importing products to advanced search filters – the list of benefits is endless. The offering is here to add value to your dropshipping business model and affiliate marketing capabilities.
This partnership between CedCommerce and Secomapp in the form of ‘UpPromote’ will help establish your brand name in the global domain, exposing your online business to your ideal target audience.
For businesses, constant monitoring and maintenance are detrimental to online success. Setting up and tracking key metrics for your eCommerce business not just helps with the ideal kickstart for your store, they even help identify potential issues and develop effective solutions.
Planning to track and get a comprehensive understanding of the data from your store can be a challenging task – especially as your online store generates lots and lots of data. CedCommerce helps with building your brand reputation, setting up your online presence, and boosting your sales. We have some even better news for you: you can simply focus on some key metrics to help boost your business.
Follow along.
This is one thing that you can claim to be your north star metric. ‘Revenue’ tells you how much profits your Shopify store is generating every month. However, don’t fall prey to the misconception of the sales number solely moving the needle. You must dive deeper and analyze what really influences your sales — both from a negative and a positive perspective.
There are numerous methods to know more about your sales figures. For instance, you can find a better analysis of your revenue to find out the exact marketing channels that drive the most amount of sales for you. Further, you get to figure out where your traffic comes from and which platforms bring in the most high-quality traffic.
On the contrary, you even get to monitor your revenue by date, time, or even month to figure out the exact time or even phases when your customers are likely to purchase from you. You also get an idea about their purchase patterns – whether they shop more on weekends and holidays – stuff like these.
Return on Ad Spend (ROAS) is a really helpful metric from Shopify Analytics that helps measure the success or failure of your paid campaigns’ success. This is a reality check that shows you the exact figures in terms of whether you are spending more on your ads as compared to your revenue.
Experts suggest that stores that focus heavily on plenty of promotion and sale campaigns generally end up with a good ROAS. However, this is not suggested to be a sustainable way to grow your business in the long run. Hence, it’s vital that you strive for customers, paying in full for your products and services, especially the ones that are coming through from paid campaigns.
With your business getting a boost, the one thing that you would definitely want to know every now and then is the count of new and returning customers that are visiting your Shopify store.
The new customers are the ones that haven’t done business with you previously while returning customers are the ones that are familiar with your products from your online store. The charges and expenditure required to return a customer are usually much less than acquiring a new customer altogether.
Let’s understand this through a simple example. Assume that you are spending $30 to acquire a customer while $25 is the average order value for your online business. Additionally, if this order happens to be just a one-off purchase for this particular customer, your customer acquisition cost may be considered high. While, if the customer comes back, regularly, for more purchases, the customer acquisition cost is fairly cheap.
To understand your users’ purchase intent you need to look closely at the ‘Cost per Add to Cart’ value and the ‘Initial Checkout’ value.
The ‘Cost per Add to Cart’ demonstrates the amount that you’re paying for each and every item that has been added to a customer’s cart.
The ‘Cost per Add to Cart’ can be reduced by:
Similarly, the ‘Initial Checkout’ value shows the exact amount that you’re paying for every time a customer initiates a checkout process. It is really astonishing how often customers end up abandoning the shopping cart. Hence, it’s crucial that your ads attract the right audience who can be successfully moved down the funnel and converted into a customer.
The average amount of money spent by a customer in one transaction is referred to as the Average Order Value (AOV). Shopify experts claim this metric to be really important for its prowess to highlight data on ad spends.
Let’s assume that your profit margin is 30% and your AOV is exactly $100. In such a scenario, you are only left with $30 to try and acquire a customer if you want to break even. On a realistic note, you are highly unlikely to attract new customers with just $30 through any of the available paid channels. But, if you are blessed with the knowledge of your AOV and profit margin, the process of choosing a channel and adhering to the budget can become a cakewalk for you.
Now, let’s take a look at five different ways through which you get to analyze your data from Shopify Analytics to attain better sales and conversions.
One of the best and most convenient places to get your hands on some basic understanding of your store’s performance is the Overview dashboard. This helps you gain helpful insights into your customers’ behavior and patterns. You even get to perform multi-level marketing, urging customers to be converted into affiliates.
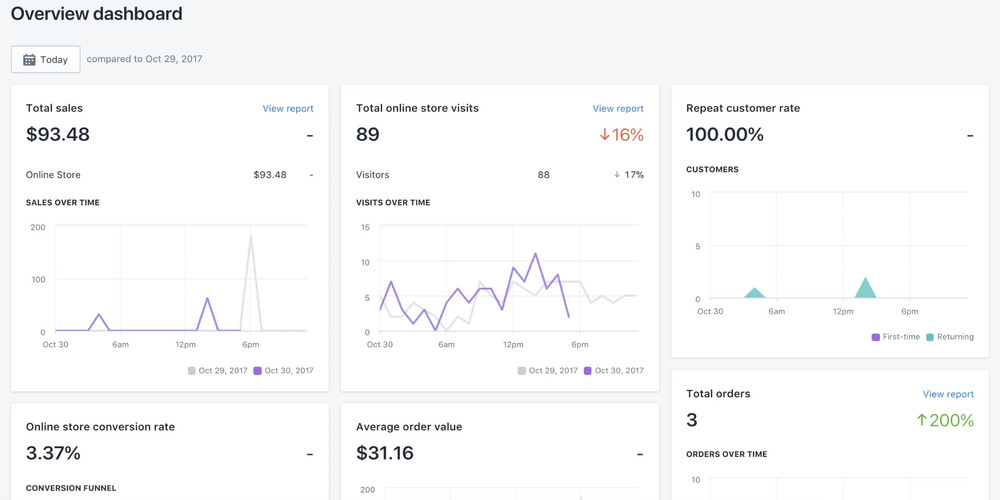
With this, you can:
As an online seller, one of the most eventful things to keep track of is the inventory quantity from your warehouse. There’s nothing more disappointing than running out of the products that your customers are highly looking for. With ‘Out of Stock’ products, the number of lost sales increases, resulting in negative customer experiences.
This is exactly when an inventory report comes in handy, big-time. This helps you effectively manage and project your product stocks. You get an overview of factors like discounts, commission, and many more.
This evaluation can help you figure out whether the conversion rate of your Shopify store has changed over a specific time period, be it, over one month or over six months. You get to streamline your store’s fulfillment process with efficient monitoring of your order stack.
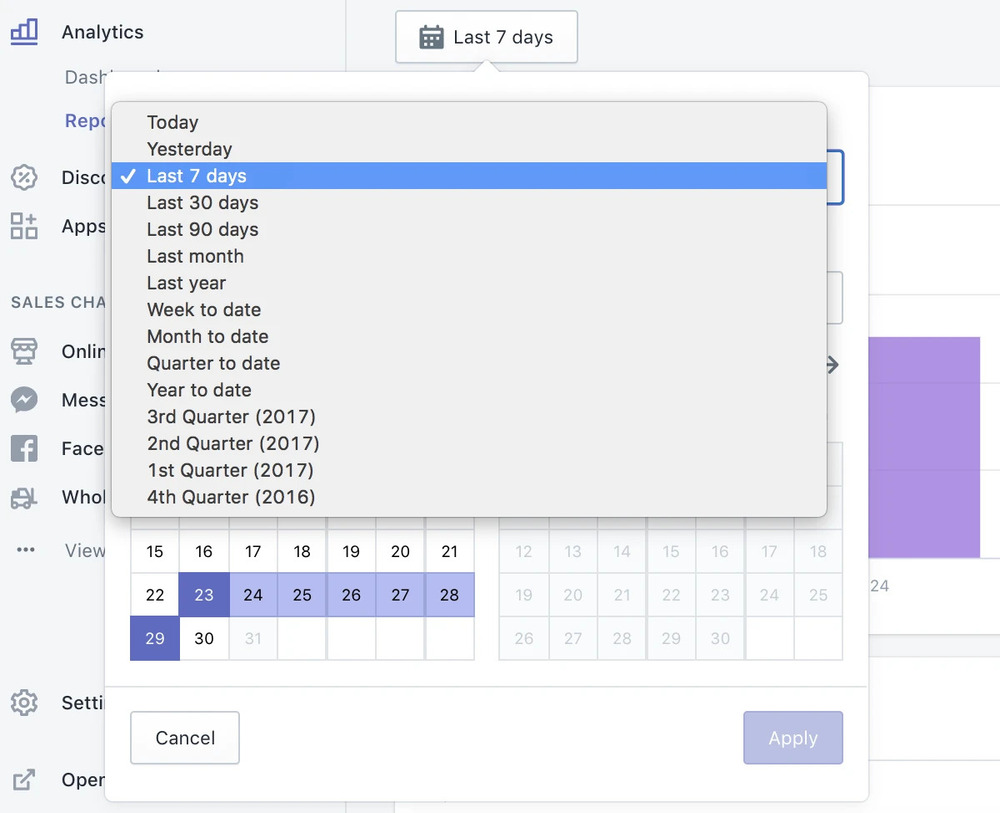
This immensely helps you realize whether the changes brought in place are bringing you dividends or not.
Let’s take a random example to demonstrate how you can use this Shopify Analytics report:
Let’s assume that your store’s conversion rate was 1.5% over the last month. Furthermore, you decide to make changes to your homepage layout to ensure the correct placement of your bestselling products. To your surprise, you discover that one month later your conversion rate has jumped up to 2.3%.
In ideal scenarios, you would use A/B split testing to discover which version of your homepage has performed better. But many sellers do not have that adequate amount of data to do this effectively. This is where your common sense combined with customer feedback comes into the picture, helping you display the products that are more loved by your audience.
If you’re on the quest of growing your store with the help of paid ads, you’ll want to double your spendings on those particular channels. After all, they bring in a good amount of sales for your business. Stop hovering over various platforms to check their individual performance. Instead, you can conveniently monitor your campaigns with a comprehensive report of all your paid channels.
For instance, in a paid channel mix report for Google Data Studio for your brand integration, you’ll see data from all over – LinkedIn Ads, Twitter Ads, Google Ads, Facebook Ads, and Microsoft Ads.
Customer Behavior reports from your pool of Shopify Analytics are one of the most useful tools at your disposal that helps you enhance your online store for the betterment.
Using Shopify’s behavior reports will demonstrate:
CedCommerce, being the official partner to UpPromote and Secomapp, can do wonders for you if you choose to start your affiliate marketing journey through this partnership. From making proper use of your Shopify Analytics to bringing them into real-time practice – the list of benefits is endless. Reach out to the experts at CedCommerce for all your eCommerce needs. From setting up your dropshipping store to marketing your brand, getting help for your graphics and content to a 24*7 comprehensive support – the team at CedCommerce will happily tackle all the difficulties that might arrive your way.
Reading Time: 3 minutes Section 1: About the Client Milky Mama is a leading maternal…

Reading Time: 1 minuteIntro Summary Shopify Scripts stopped executing entirely on June 30, 2026. Merchants…
Reading Time: 9 minutes Your buyers are not shopping in one place anymore. They search…
Reading Time: 8 minutes If you’ve been running your Etsy store through Shopify Marketplace Connect,…
Reading Time: 12 minutes From Etsy policy changes, such as fees and payments, to creativity…
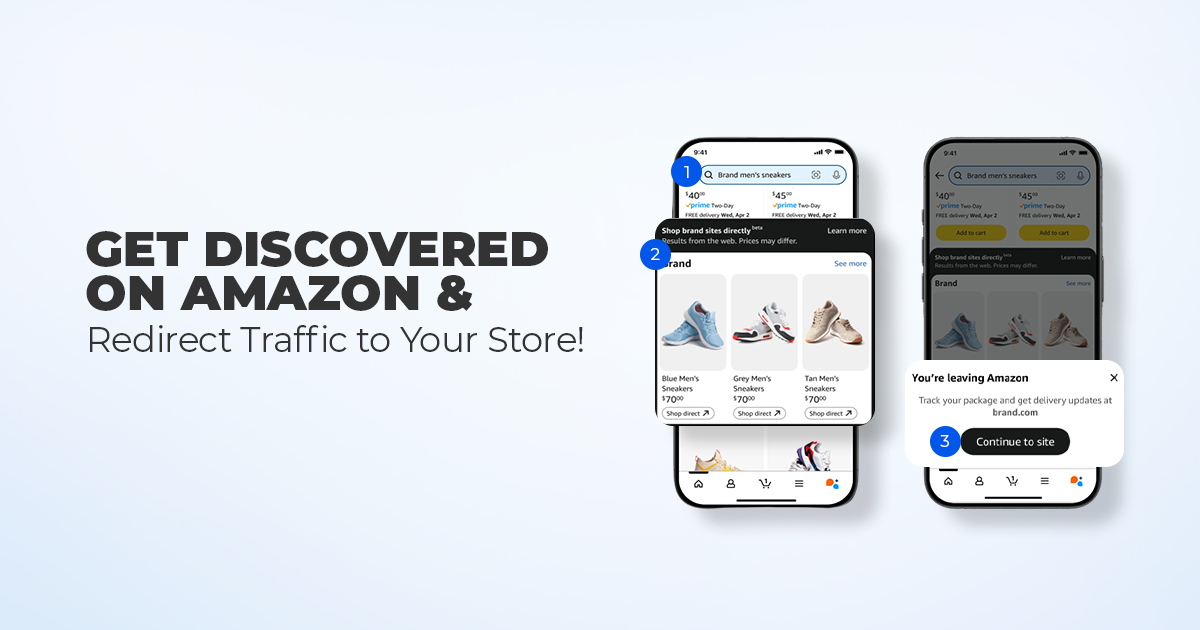
Reading Time: 11 minutes What if reaching hundreds of millions of Amazon customers didn’t mean…

Reading Time: 2 minutes Amazon is rolling out a significant update that will directly impact…

Reading Time: 2 minutes When OpenAI confirmed a 4% transaction fee for Shopify merchants selling…
Reading Time: 1 minuteShopify has announced that offline payments now work across multi-entity Shopify Payments…

Reading Time: 13 minutes Print on demand on Etsy is no longer a low-effort side…